

Kitwave Group - Overview and Highlights
A 15-Year Compounder Hiding in Plain Sight: 14% Revenue CAGR, 98% Service Reliability, 90% Cash Conversion, 7% FCF Yield, 5% Dividend — Trading at Just 8.6x Forward Earnings


Business Description
Kitwave Group is a UK wholesale distributor serving 46k+ independent convenience and foodservice outlets with c. 40k SKUs across ambient, chilled, frozen, and foodservice. National delivery footprint, 37 depots, c. 650 vehicles, 6,500 daily drops. Recent Creed acquisition created a truly national foodservice platform. Sources: FY24 AR and H1-FY25 deck.
Investment Thesis
Thesis in one line: Repeatable 3 to 4 percent organic growth plus disciplined bolt-ons, rising foodservice mix, 98 percent service levels, 90 percent cash conversion, and low leverage create a durable compounder priced at a cyclical trough.
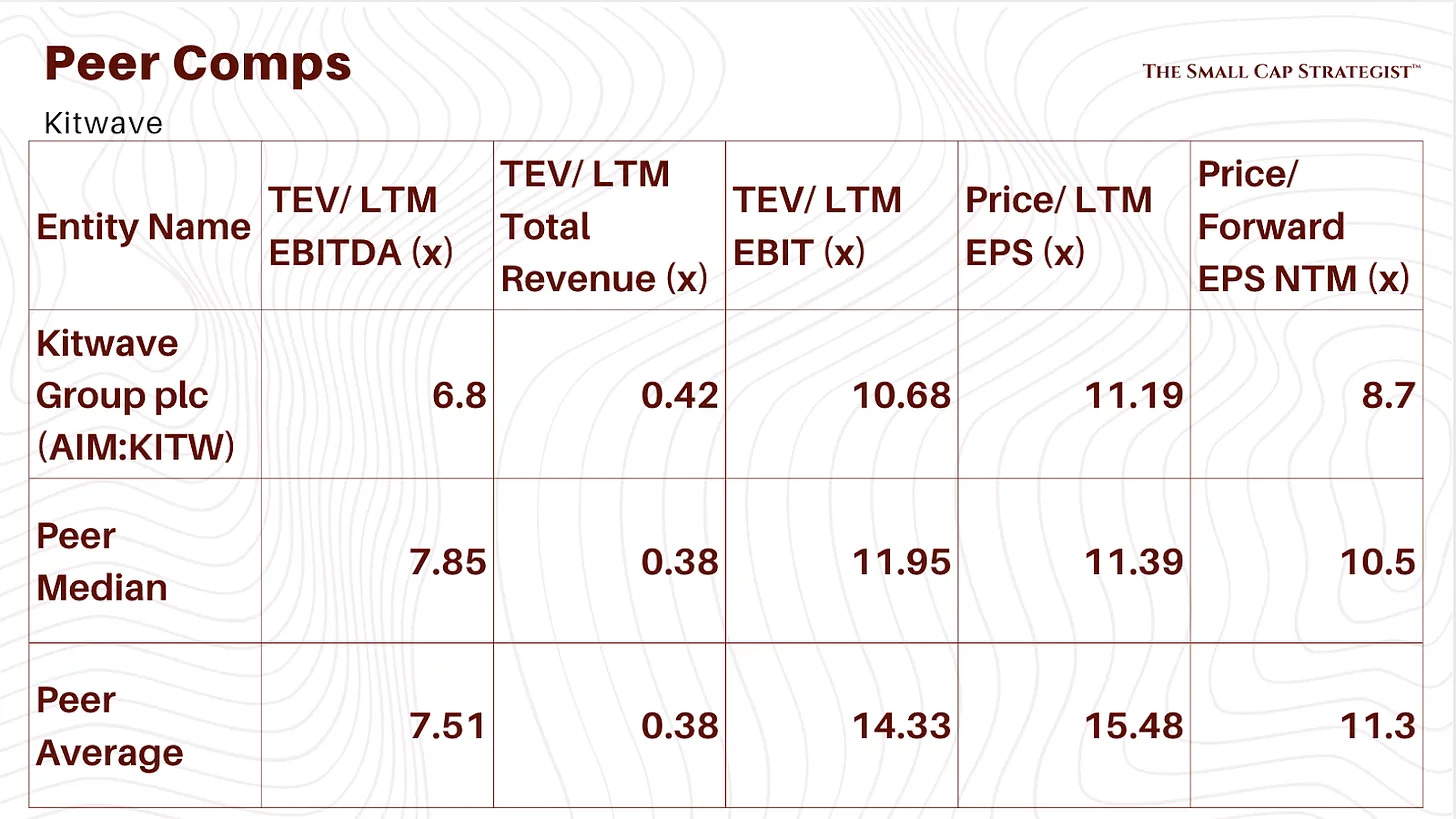
Margin of safety: Forward P/E around high single digits on your slide, EV/EBIT c. 8x forward, dividend 11.3p FY24, leverage ex IFRS16 1.9x.
What a short case look like?
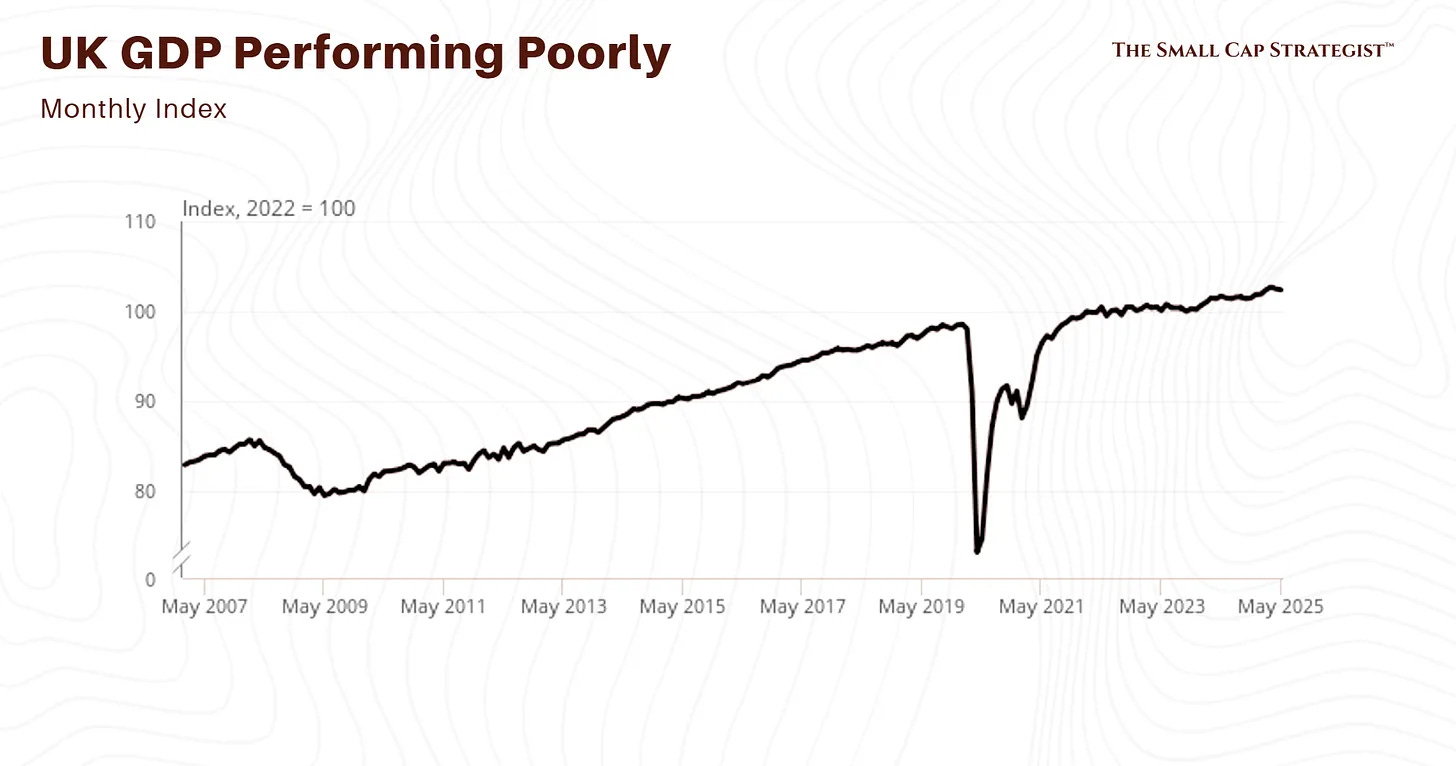
Operational complexity from integrations persists, UK demand stays weak, wage and NI rises weigh on distribution costs, and synergy delivery undershoots, keeping leverage and working capital elevated. Dividend becomes less secure if acquisitions consume cash without returns.
Risks
Low-margin industry, integration execution, input and regulatory cost inflation, UK macro softness, and working capital swings typical of wholesalers. Covenants include a net debt to EBITDA ceiling on the CID facility.
Required Scuttlebutt
Cross-check CRG and Unitas relationships, depot consolidation impacts in the South West, and route density after Creed. Validate service reliability with independent operators.
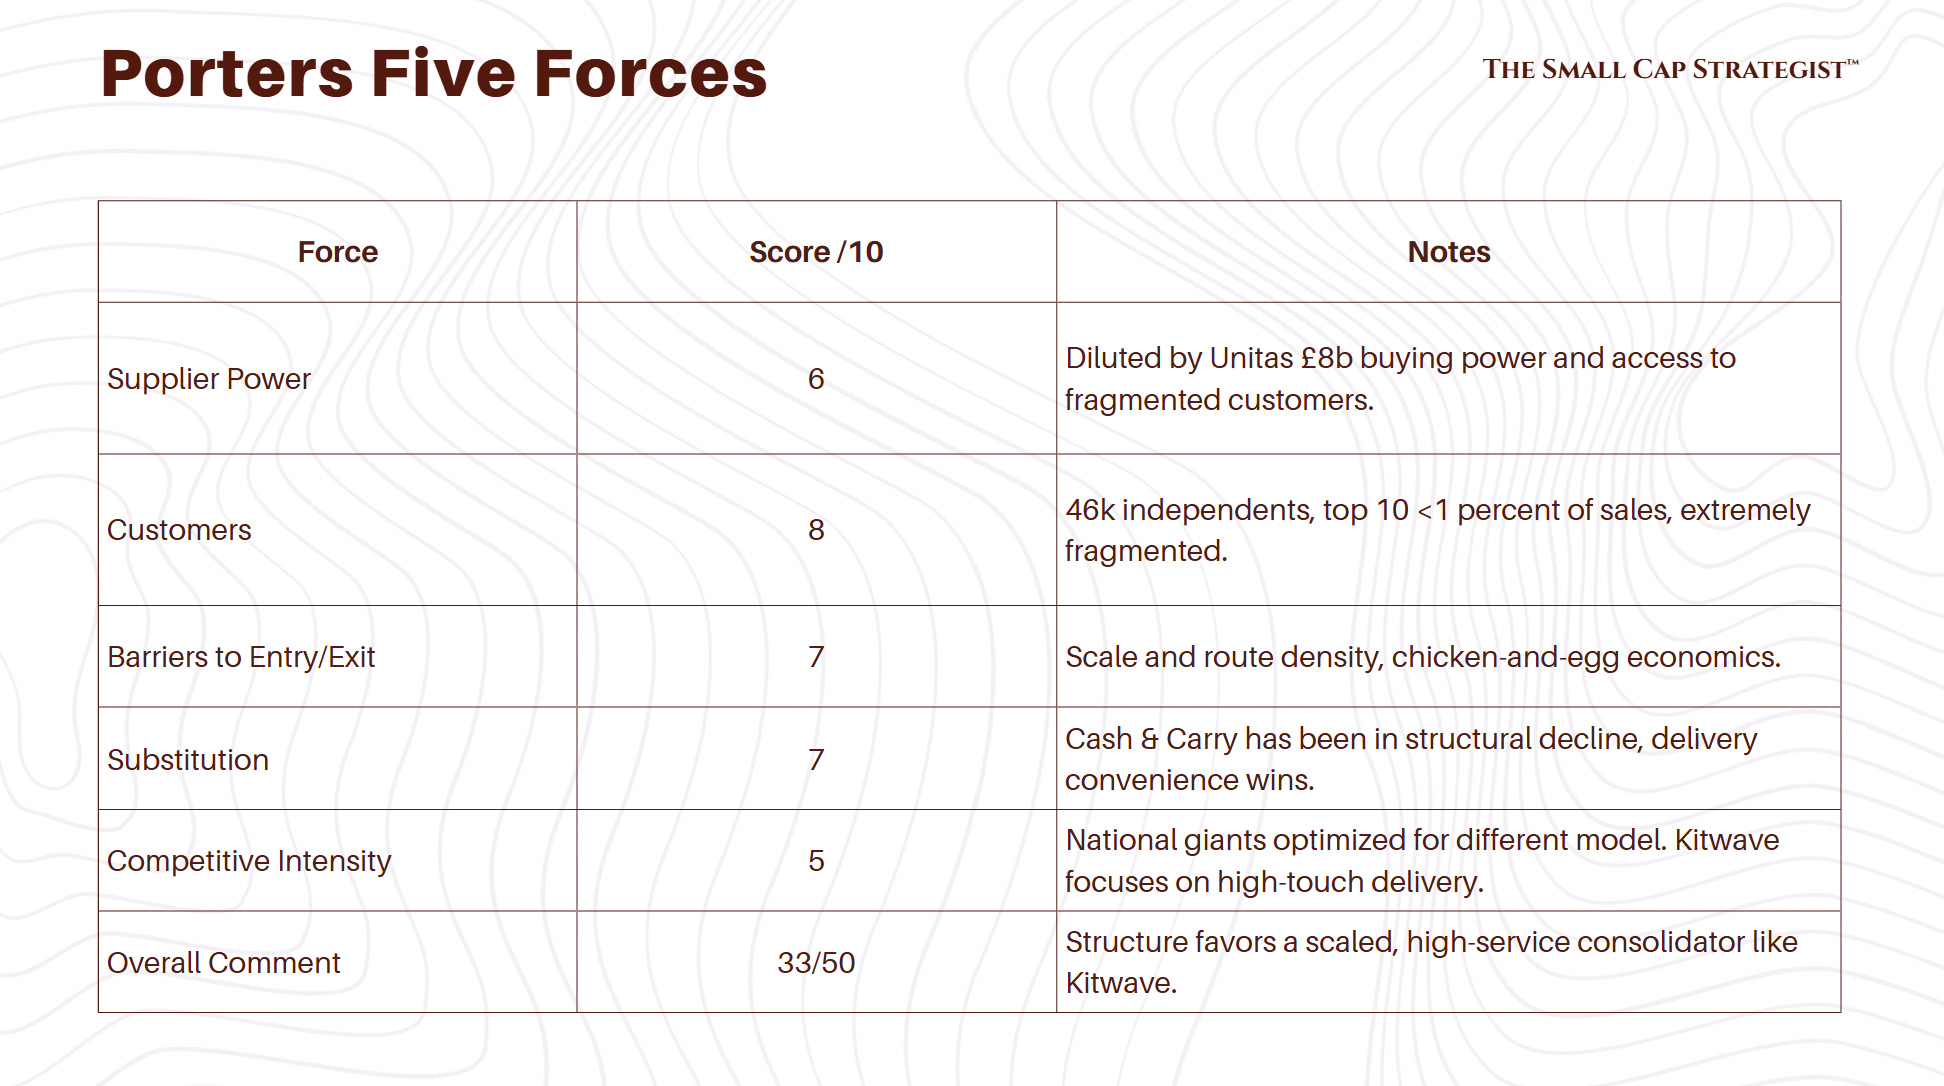
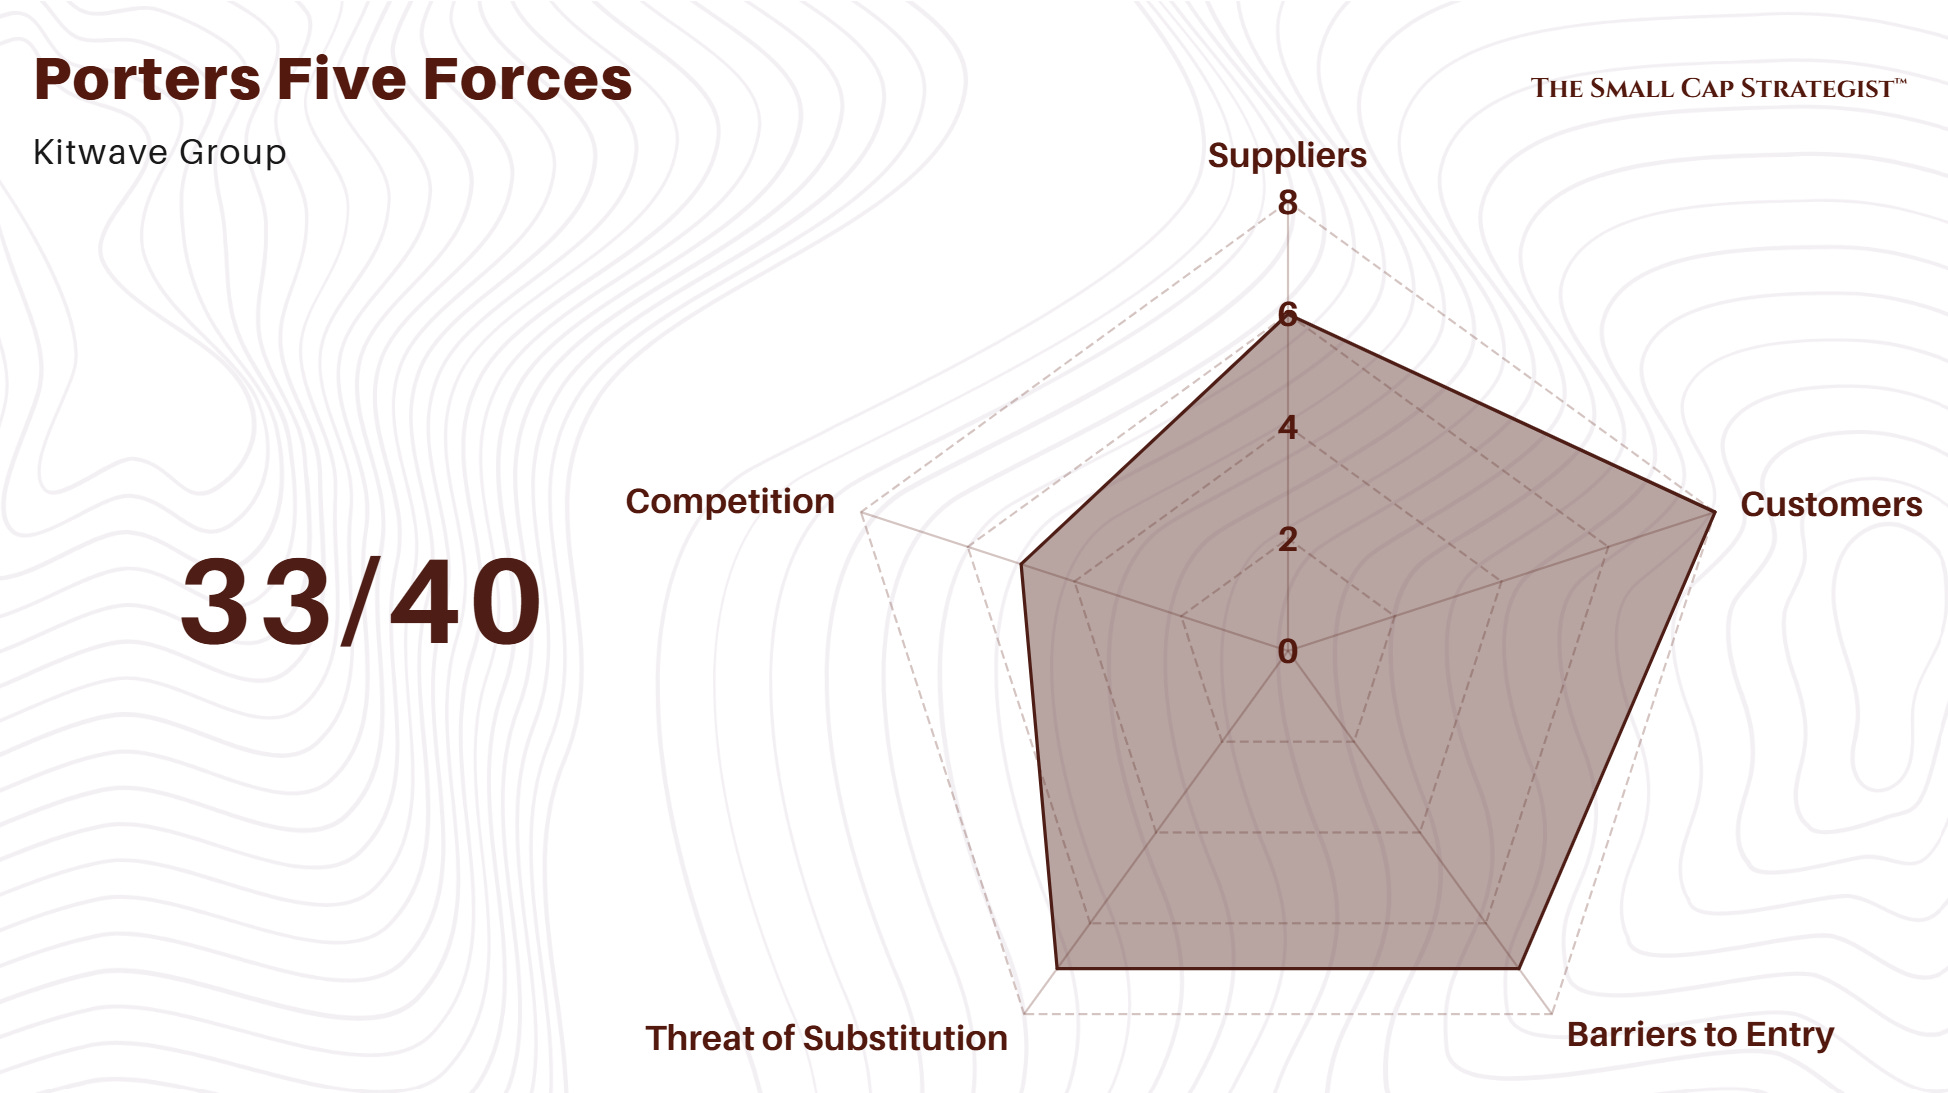
Porters Five & Competition
Market Position & Share
~8 percent share in retail & convenience, ~5.6 percent in foodservice. Post-Creed, full national foodservice coverage with 37 depots, 650 vehicles, 6,500 daily deliveries. Strong platform for bolt-on integration.
Differentiation
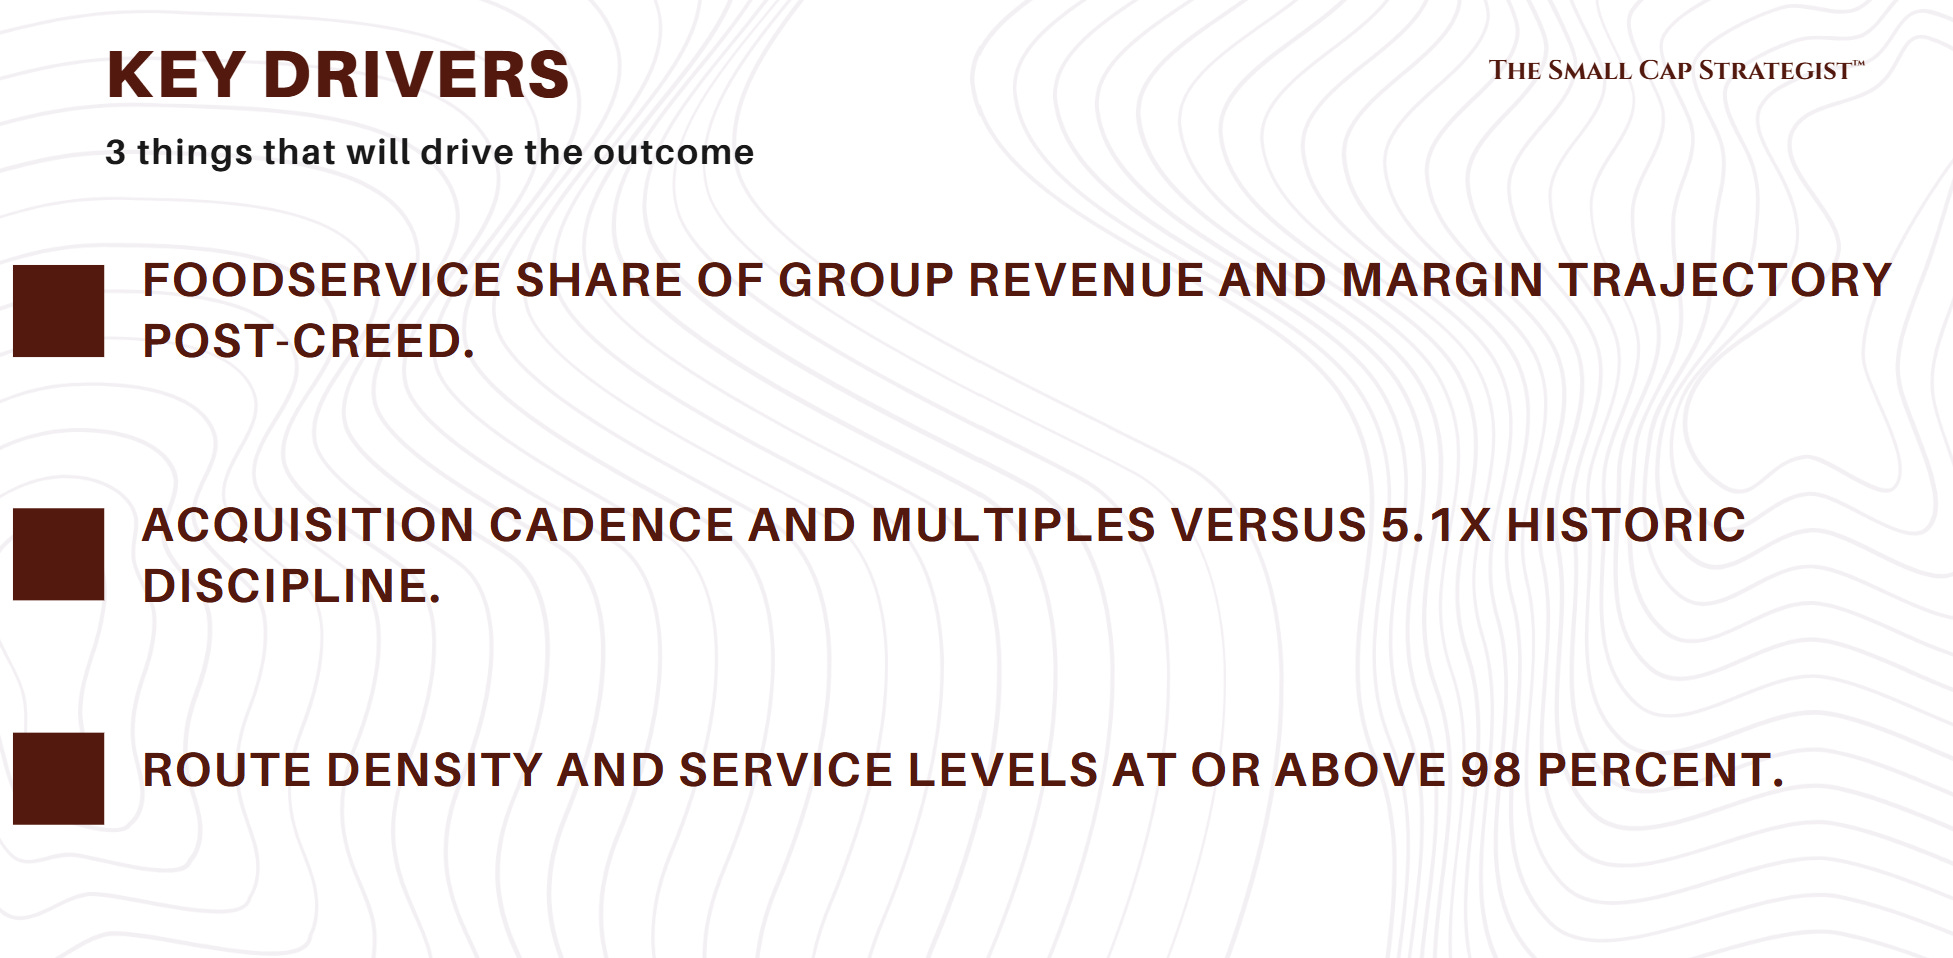
98 percent on-time/in-full delivery, £100 minimum order, wide basket (ambient, chilled, frozen, foodservice). Enables independents to consolidate suppliers and replenish frequently.
Sources of Moat
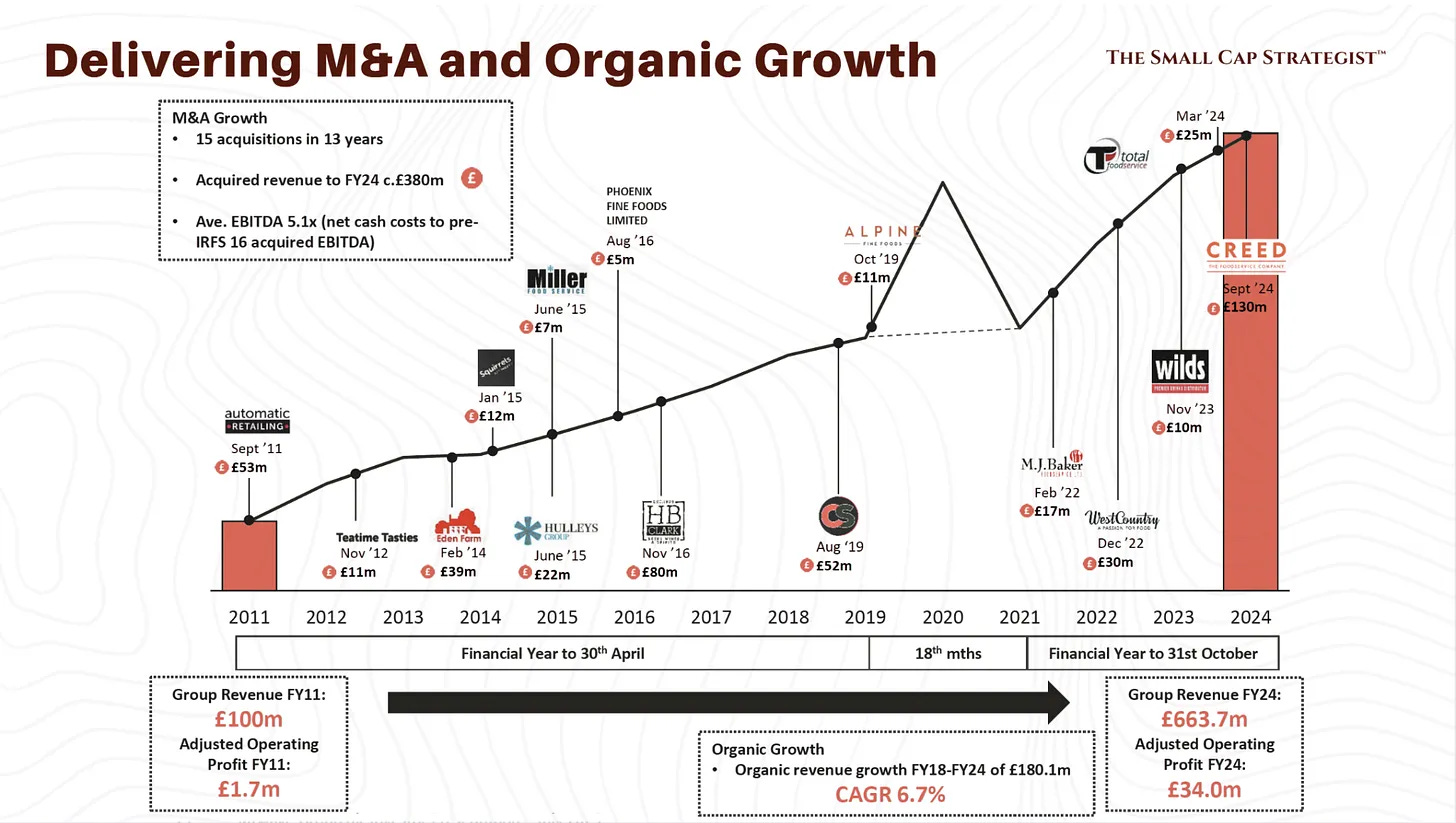
Density flywheel: more customers per route lower per-drop costs → funds better service → attracts more customers. Buying scale via Unitas £8bn group, plus proven M&A integration (15 deals in 13 years at ~5x EBITDA).
Pricing Power
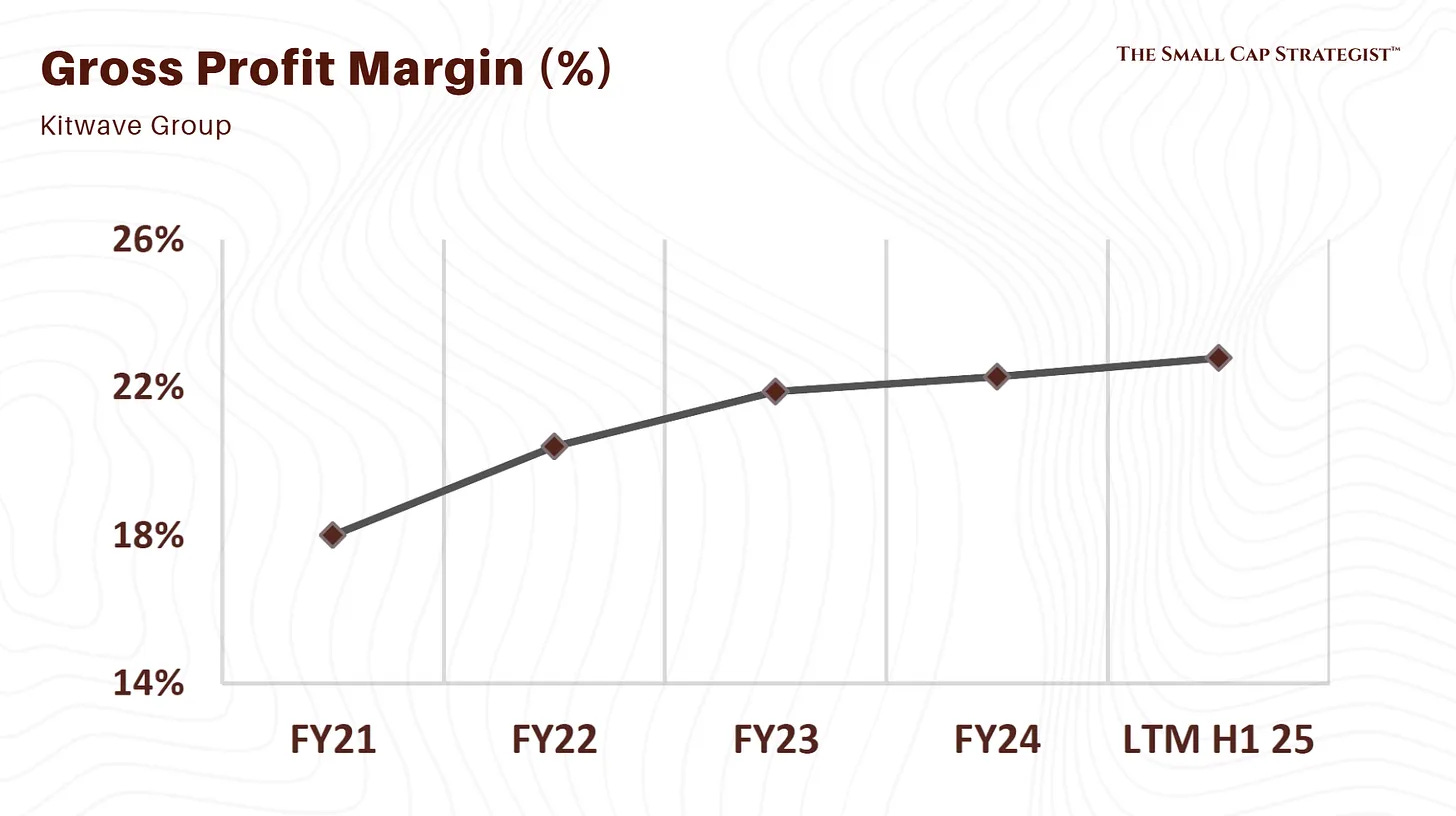
Gross margin expanded from 20.4 percent (FY22) to 22.6 percent (H1-FY25). Reliable service and fragmented customers enable consistent pass-through of supplier cost inflation. Broad basket allows cross-selling and upselling.
Moat Quality
Niche but durable. Large rivals lack infrastructure for small mixed drops, regionals lack scale/reliability. Each acquisition deepens density, strengthens supplier terms, and broadens coverage, reinforcing a self-sustaining moat.
Booker and Bestway in cash-and-carry-centric retail wholesale, Bidfood in foodservice. Kitwave competes head-to-head mostly in foodservice after Creed.
Revenue & Cost
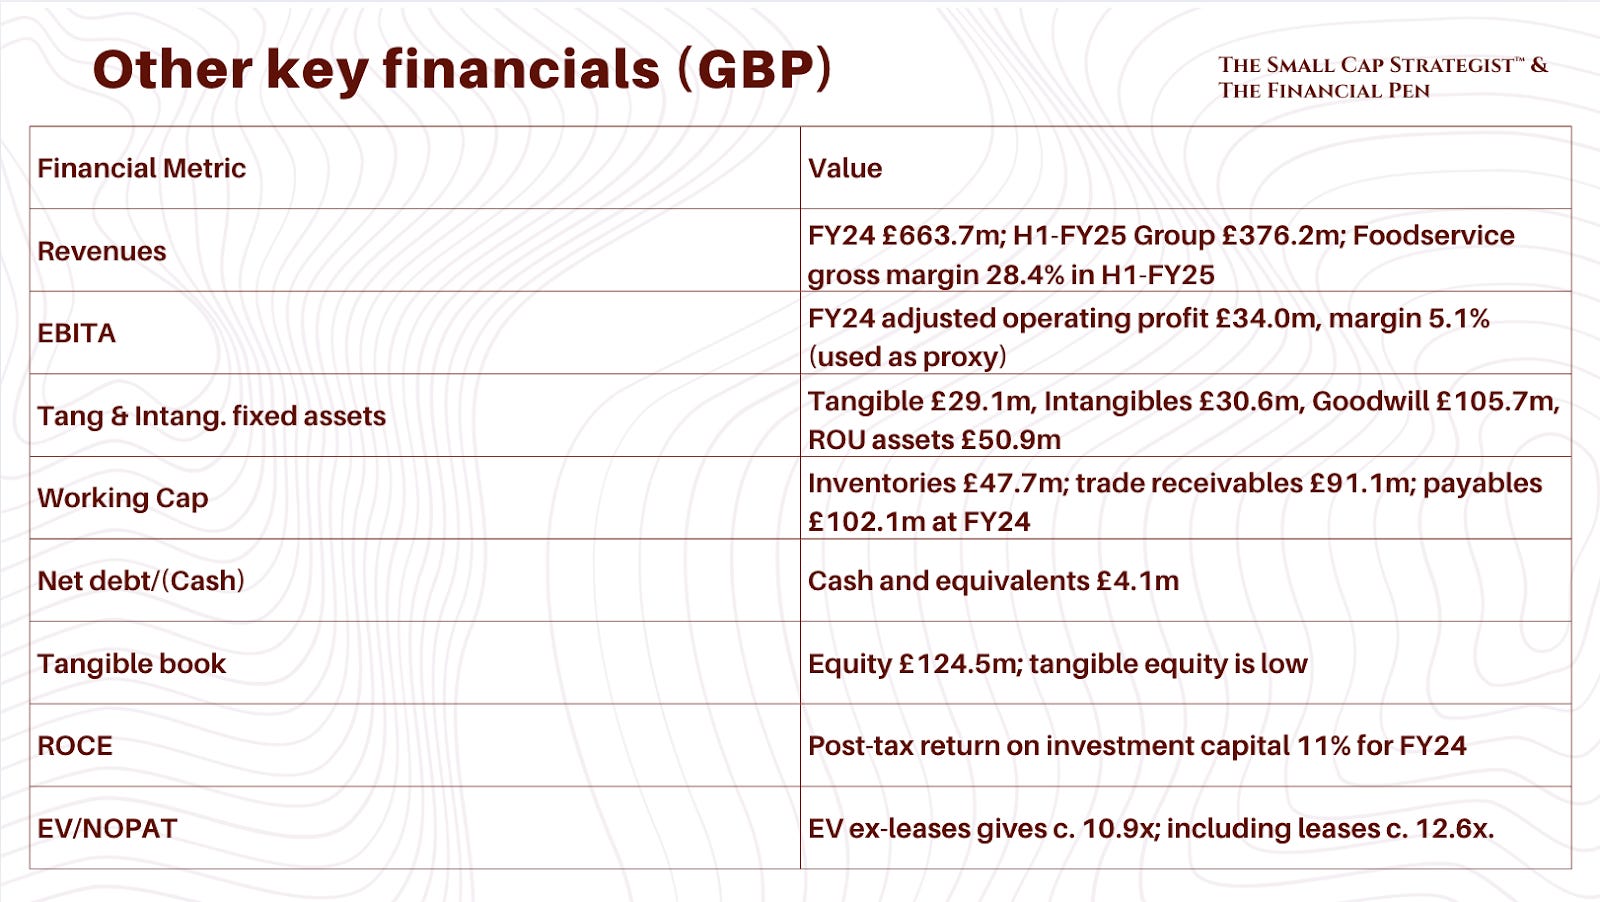
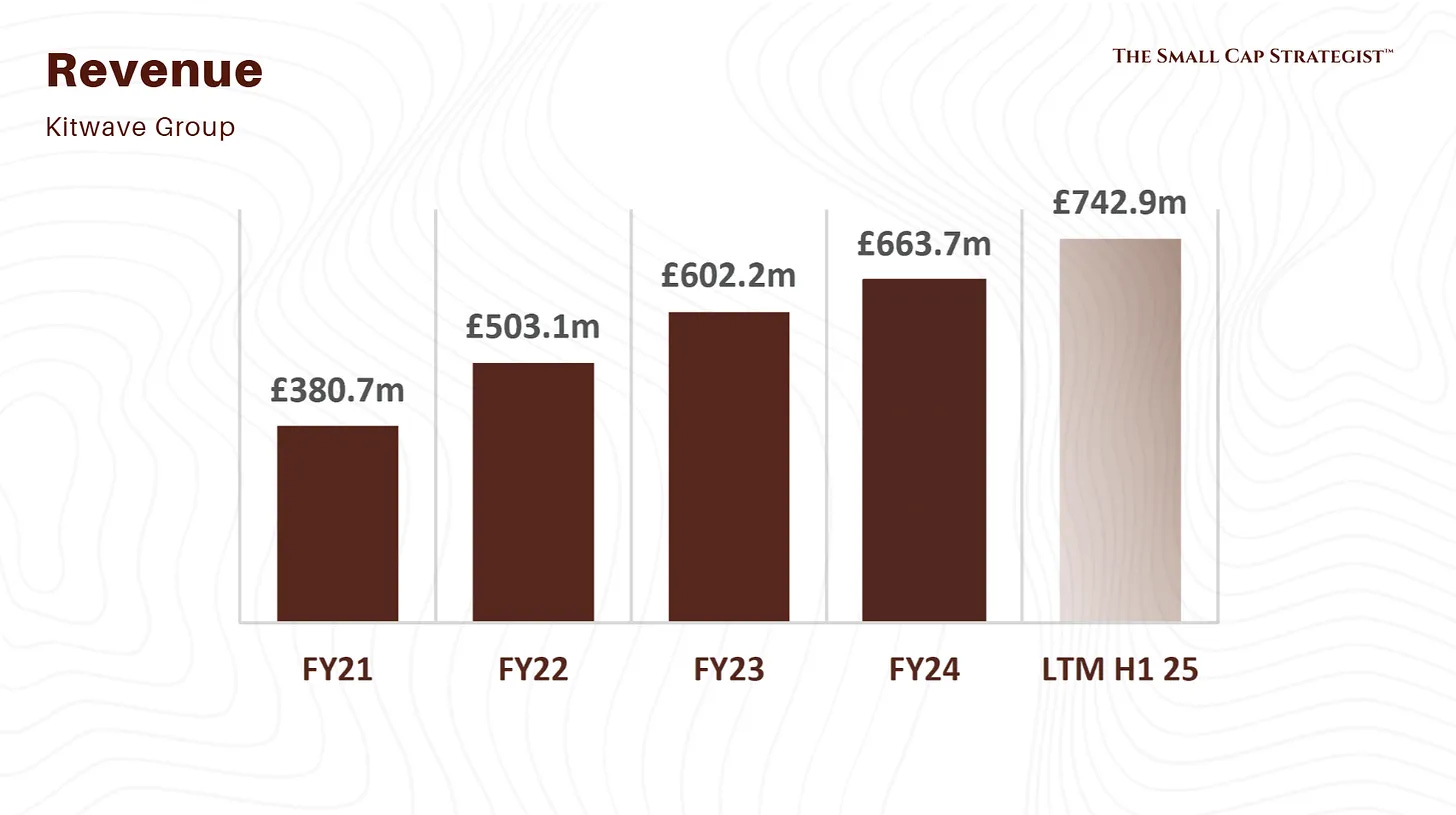
Overall: FY22 to FY24 from £503.1m to £663.7m, H1-FY25 group £376.2m.
Volume: Organic 3 to 4 percent historically.
Pricing: Largely passed through.
Mix: Foodservice growing faster, higher margin. H1-FY25 foodservice GM 28.4 percent.
Summary: Distribution business, COGS heavy, delivery and admin costs meaningful, operating leverage as scale builds.
COGS & Gross Margin: FY24 GM 22.3 percent, rising trend.
Opex & Operating margin: FY24 AOP 5.1 percent, H1-FY25 group AOP £13.2m.
Exceptionals: Acquisition and integration effects present.
Returns: FY24 post-tax ROIC 11 percent, depressed by timing of Creed.
Allocation of Capital
15 acquisitions over 13 years, disciplined prices, equity raise and RCF used to fund Creed. Dividends paid £7.9m FY24.
Balance Sheet
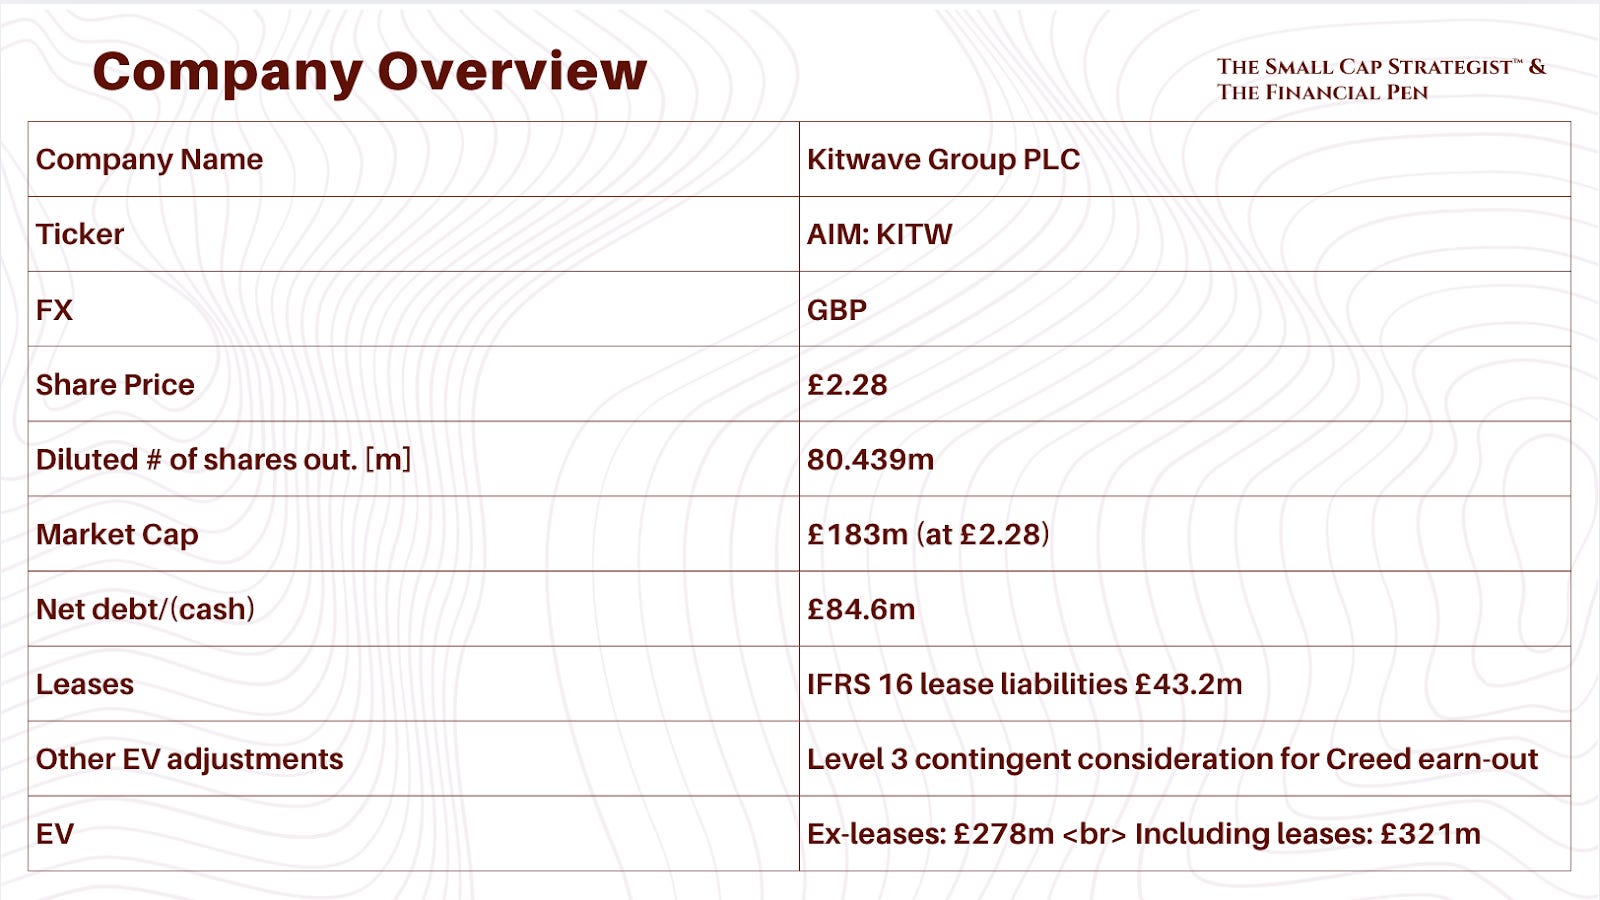
Facilities £121.4m including £43.2m leases, undrawn £35.2m at year-end. Cash £4.1m. CID covenant at 3.0x ND to EBITDA including IFRS16.
Cash Flow
Operating cash flow £31.4m FY24, pre-tax operational cash conversion 90 percent.
Valuation
Dividend: 11.3p FY24 declared total.
Leverage: 1.9x ex leases, 2.8x including.
EV/NOPAT: ≈ 11x ex leases using FY24 AOP taxed, rising mix and synergies are the re-rating path.
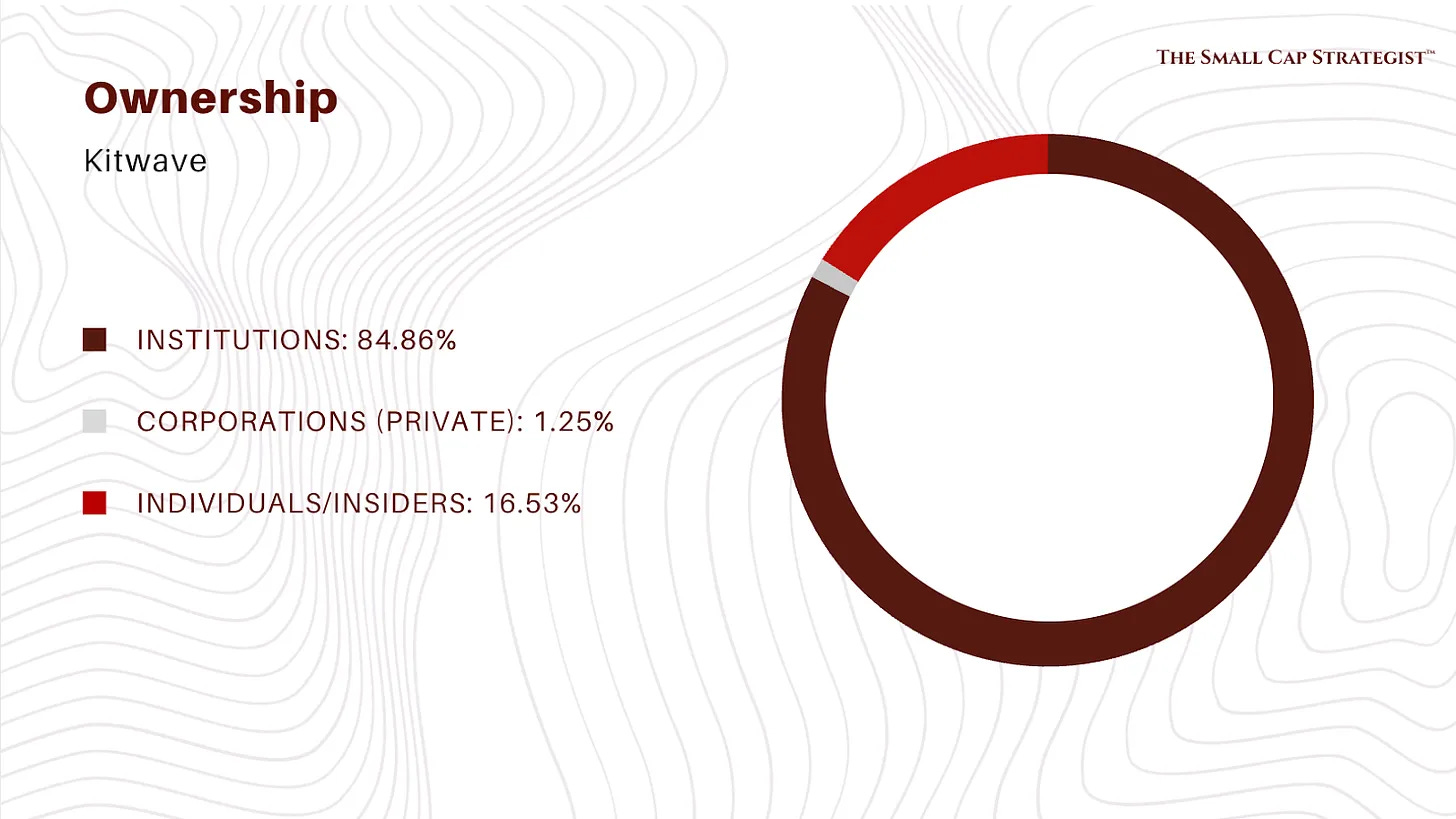
Management & Ownership
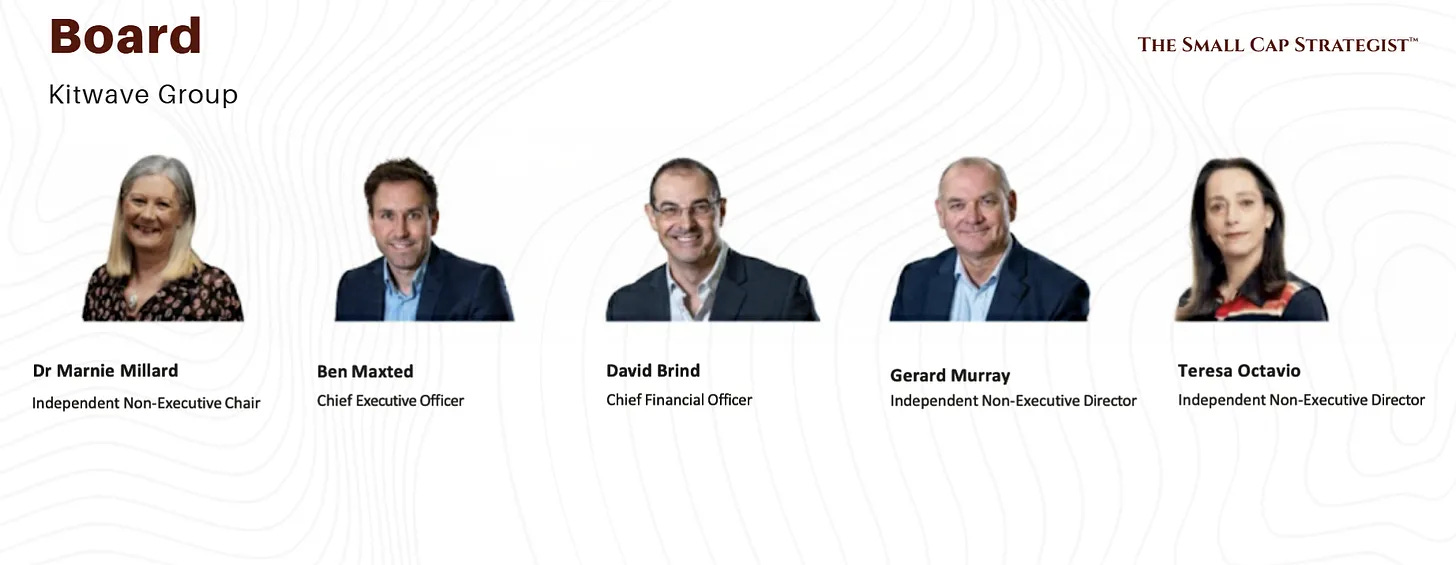
CEO: Ben Maxted, stepped up Mar-2024, with tenure since 2011.
CFO: David Brind, since 2011, architect of M&A; clear capital markets comms, explains returns metrics and Creed timing effect.
80.439m shares in issue post Sept-2024 raise. MIP allows up to 3.22m exchangeable at max.
Other Notes
Broker Coverage: Light broker and analyst coverage, which contributes to the mispricing.
History: IPO in 2021, equity raised Sept-2024 to fund Creed; Total Foodservice acquired Mar-2024.
Industry Overview: UK grocery and foodservice wholesale, structurally shifting from cash-and-carry to delivered. Fragmented long tail suits a buy-and-build.
Operational Overview: 37 depots, national delivered model, 98 percent service levels, route density flywheel, CRG buying scale.
Base, Bear, Bull
Inputs and shared assumptions
FY24 AOP £34m, tax 25 percent, NOPAT £25.5m.
Organic 3 to 4 percent, modest mix shift to foodservice, and Creed synergies lift AOP margin by 20 to 40 bps over 18 to 24 months.
Share count 80.4m.
Base
NOPAT grows to £28m in 2 years, net debt ex leases held around £85m. Put 12x EV/NOPAT on ex-leases gives EV £336m. Equity value ≈ £336m − £85m ≈ £251m, or c. £3.12 per share, plus dividends.
Bear
Integration slippage and weak leisure spend keep NOPAT flat at £25m, market pays 10x. EV £250m. Equity ≈ £165m, about £2.05 per share. Dividend covered but slower M&A.
Bull
Synergies and mix give NOPAT £32m, market recognizes platform, pays 14x. EV £448m. Equity ≈ £363m, about £4.51 per share. Optionality for a sponsor bid adds upside.
Questions for an investor:
Are you underwriting margins or volume as the primary driver, and what is your explicit synergy bridge for Creed over 24 months?
What is your downside case on debtor days and the CID covenant headroom if UK demand softens?
What multiple do you ascribe to Kitwave versus UK private deals in distribution, and why should that converge in public markets?
Before sizing, what is your max acceptable drawdown at the bear price, net of expected dividends?
If you enjoyed this post consider supporting us by becoming a paid or free subscriber.
Disclaimer: This post is for informational and educational purposes only and should not be considered investment advice. The author is not a financial advisor. All investment decisions carry risk, and readers should consult with a qualified financial professional before making any investment choices. The author may or may not hold positions in the securities discussed. This post may not be an accurate reflection of Karnov Group or its related companies. Read the full disclaimer in the ‘About Me’ section.
Interesting breakdown. How confident are you that Kitwave can keep integration smooth post-Creed while still protecting its 90% cash conversion? That seems like the key swing factor for whether the dividend stays safe or gets pressured by working capital.