

Software Is Breaking CLOs
227 loans. 37 managers holding the same 15 distressed credits. The CUSIP-level evidence behind the reflexive loop.


The average software loan bids at 86 cents. The median bids at 95. If you stopped at the average, you would think the sector is sick. If you stopped at the median, you would think it is fine. Both are wrong, and the 8.5-point gap between them is the single most important number in credit markets right now.
I pulled 227 active software term loans from the Bloomberg Terminal. Every institutional-scale credit that matters for CLO and BDC portfolios, the near-complete universe. 72 instruments bid above 95: Oracle, SS&C, business as usual. 34 bid below 80. Fifteen of those below 50. SonicWall at 30 cents. The distribution is not a bell curve. It is two peaks with a valley in the middle, and the valley is where capital goes to die.
But the traded credits are not the scary part. 66 of the 227 instruments have no observable bid at all. No dealer making a market. No Bloomberg composite. 29% of the software loan universe is operating in the dark, and the composition is not random: 81% of PIK-TERM instruments and 83% of unitranches have no price. These are the credits held by BDCs marking to model, paying cash dividends on phantom income, with no secondary trade to confirm or contradict the marks. Names you would recognise (Zendesk, Hyland, Alteryx, Squarespace, CoreWeave), billions in outstanding debt, and no market-based price.
In Don't Short SaaS I argued that the "AI kills SaaS" narrative was wrong, that the real divide was between a Fortress Zone of entrenched platforms with 97%+ gross retention and a Dead Zone of commoditised tools already losing altitude. In Private Credit Is Eating Itself I mapped the mechanism: a self-reinforcing cycle where markdowns in one portfolio mechanically propagate to every other portfolio holding the same credit, amplified by CLO overcollateralisation tests and BDC dividend obligations. In Private Credit Is Lying to You I showed where the illusion is most acute: PIK instruments paying phantom income, unitranches with no secondary market, and managers marking to model because no observable trade exists to mark against.
This piece does what the first two promised. It opens the Bloomberg Terminal and shows you the wiring diagram: the CUSIP-level proof that 37 CLO managers hold positions across the same 15 distressed credits simultaneously, the maturity cliff that forces 48 instruments into a binary refinance-or-restructure outcome by 2028, the 28-point price cliff between B-minus and CCC+ that turns a single-notch downgrade into a portfolio event, the EU CLO contagion channel I did not expect to find, and the 126-percentage-point NAV gap between the best and worst BDC manager.
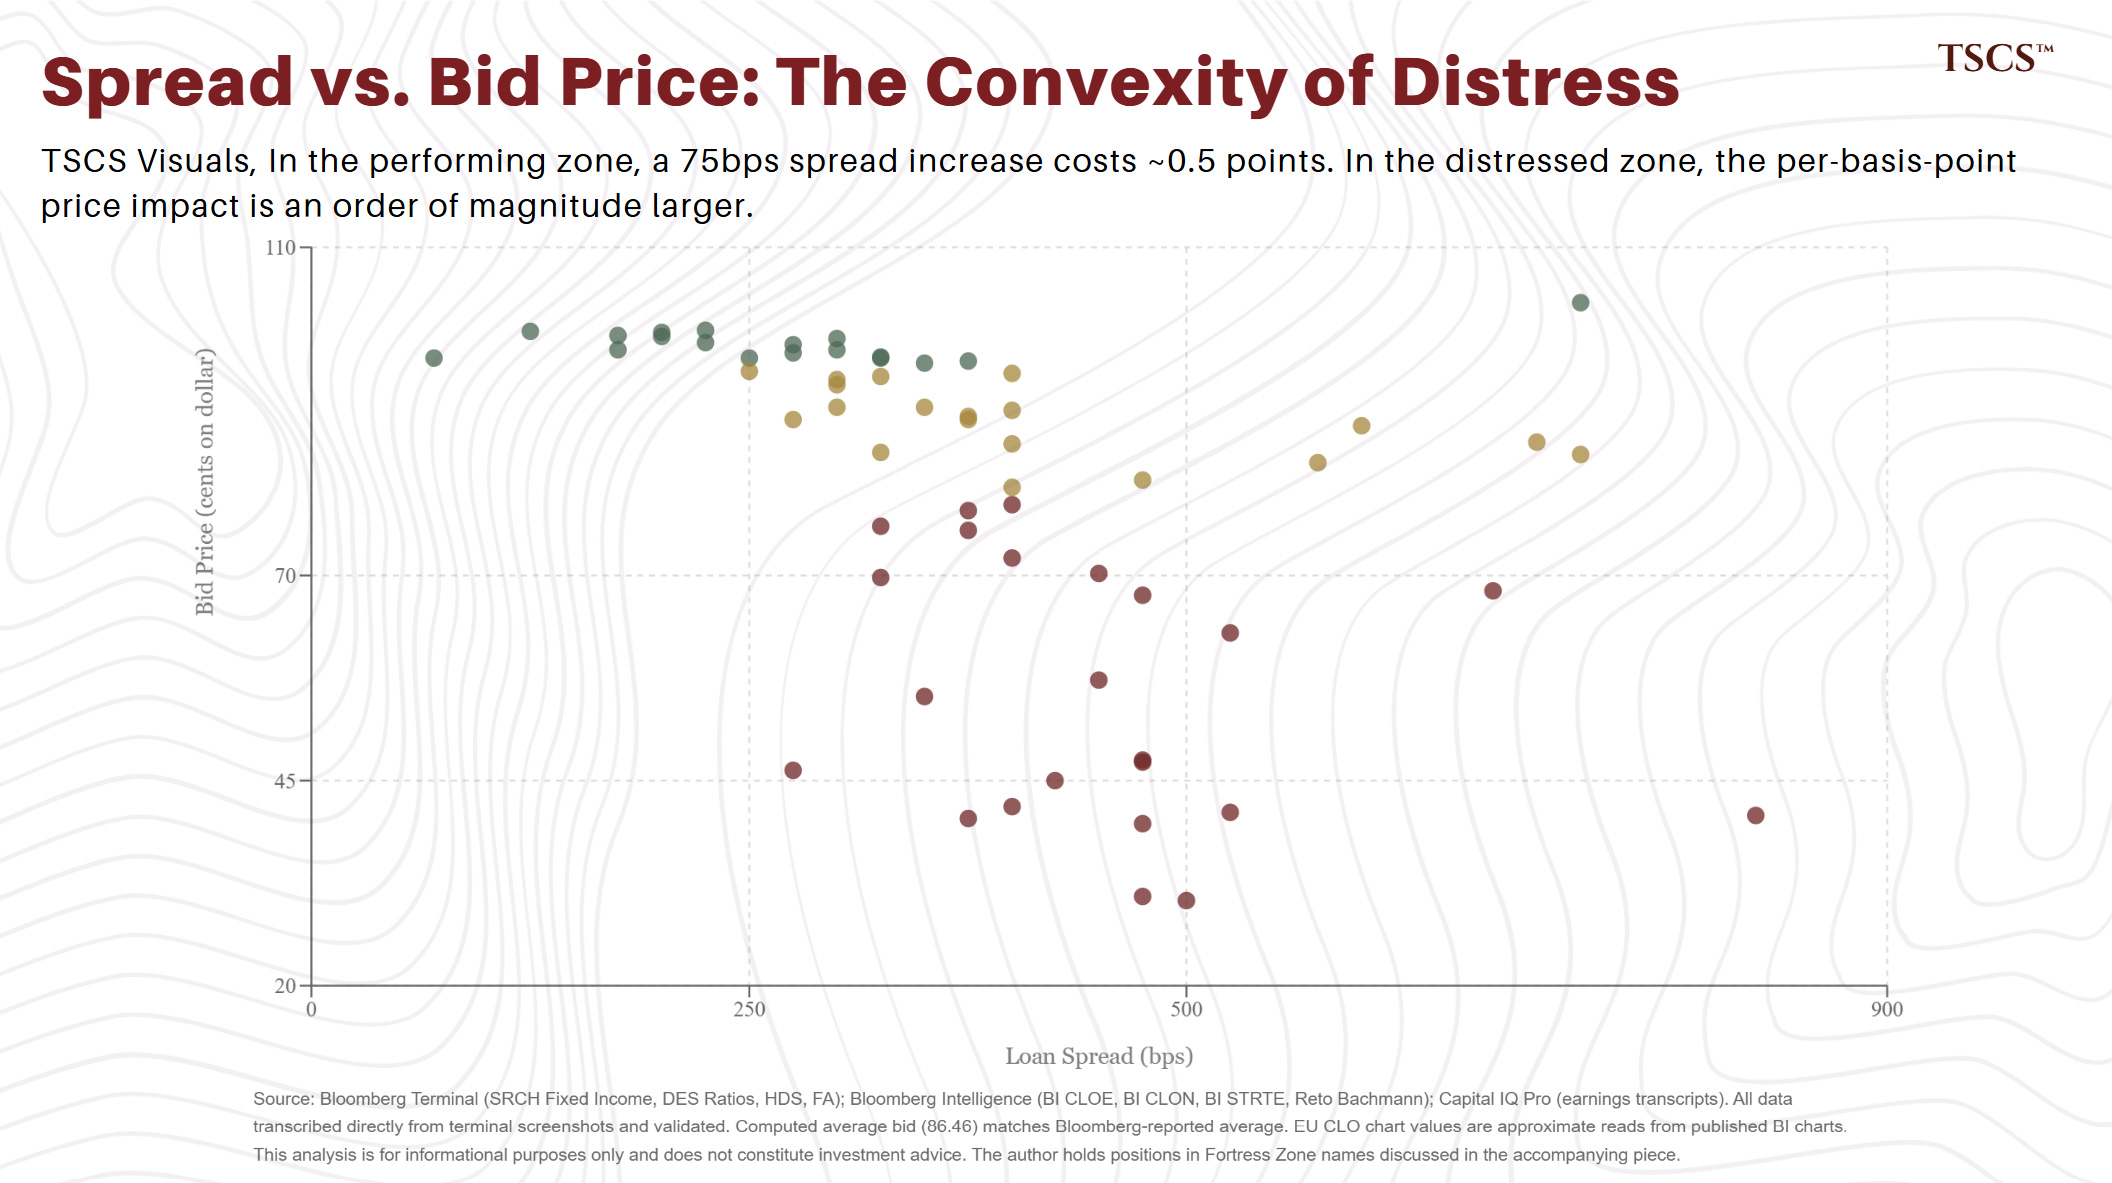
Every chart and table is built from Bloomberg Terminal data. The computed average bid matches the Bloomberg-reported average exactly. This is, to my knowledge, the most comprehensive public analysis of the software leveraged loan market. The dataset, the overlap network, the positioning framework, and the instrument-level evidence are below.
Subscribe to TSCS to read the full analysis. Paid subscribers get access to the complete 227-loan dataset, the CLO holder overlap map, the BDC quality spectrum, and the positioning framework I am using to build into Fortress Zone names ahead of Q1 earnings. If you manage capital with software credit exposure, this is the piece your risk committee will wish they had read in March.
Keep reading with a 7-day free trial
Subscribe to TSCS to keep reading this post and get 7 days of free access to the full post archives.