

There Is No Power
The structural deficit behind every AI trade, every utility bill, and the first grid reliability failure in American history.


The US government just wrote a $26.5 billion check to keep the lights on. Three months earlier, the largest electricity market in the Western Hemisphere failed its own reliability test for the first time in history. These are not separate stories. They are two symptoms of the same crisis, and if you are not positioned for it, you are about to watch the most obvious capital reallocation cycle in a decade pass you by.
America’s power grid is breaking apart, not in the dramatic, blackout-on-CNN sense (though that nearly happened in January), but structurally. The country that built the internet cannot build the power plants to run it. Demand is hitting records nobody forecasted. Supply is stuck behind four-year permitting queues and seven-year turbine backlogs. And the market is still pricing half the value chain as if this is a normal cycle.
In December, we published There Is No Cloud, a 100+ page primer on the thermodynamics, scarcity, and heavy assets powering the AI revolution. This piece is what comes next: the grid itself.
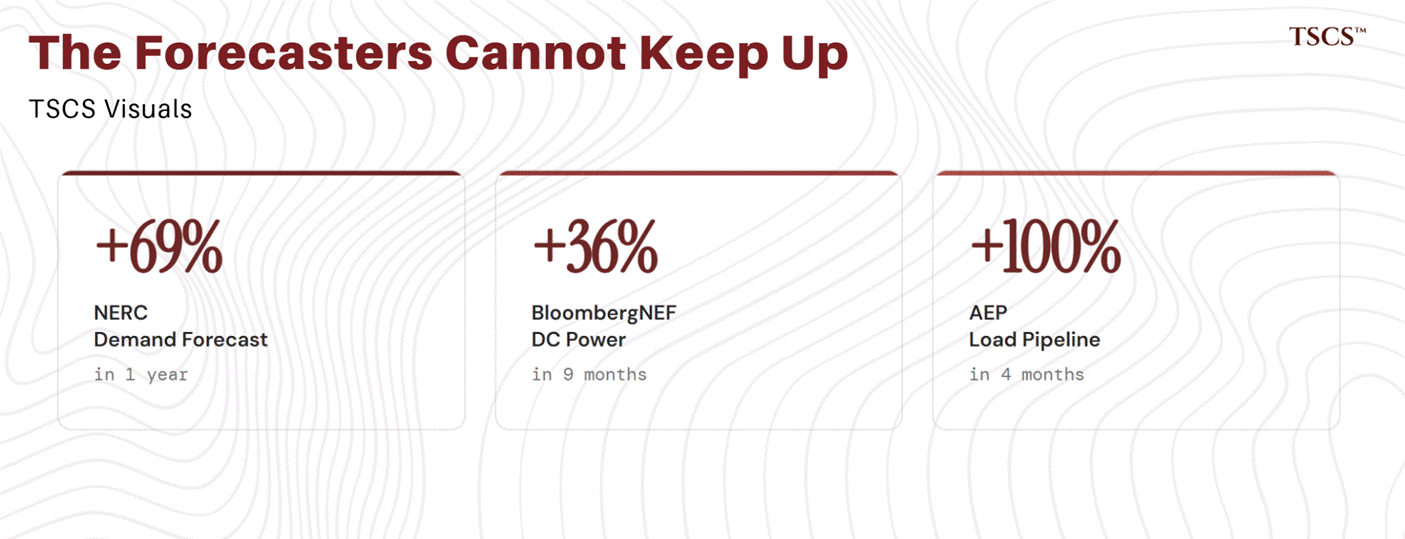
This is not a normal cycle. This is the first genuine electricity shortage in the United States since the regulated era, and it is arriving at the precise moment that AI, data centers, and reshoring are producing the strongest demand growth since the early 2000s. NERC, the body whose sole job is grid reliability, just revised its demand forecast upward by 69% in a single year. PJM capacity prices have risen 11x in three delivery years. One company, OpenAI, needs more new generation than the entire US added in 2024.
The deficit is real. The question that matters for your portfolio is not whether it exists, but how long it lasts, where the returns concentrate, and what the market has already figured out versus what it has not.
That is what this piece answers.
What this piece covers:
Why US electricity demand just posted its strongest four-year growth since the turn of the century, and why every major forecaster keeps getting surprised to the upside
The structural bottleneck: how interconnection queues, turbine shortages, and permitting gridlock are preventing $33 billion offers from translating into actual megawatts
The market nobody is watching: why the regulated Southeast is building while deregulated markets are still debating, and what that split means for where returns concentrate
PJM’s capacity crisis: an 11x price increase, a first-ever reliability failure, and a political intervention that has no precedent in modern grid history
The full investment framework: regulated utilities, merchant generators, gas turbine OEMs, midstream infrastructure, and data center REITs, who benefits, who is overpriced, and where the market has mispriced the duration of the cycle
What breaks the thesis: the specific conditions, metrics, and timelines that would prove me wrong, because a thesis that cannot be falsified is not analysis
This is the most comprehensive analysis of the US grid deficit and its investment implications published anywhere this year. It took over 120 hours of research. If it helps you think more clearly about what is coming, consider sharing it with someone who allocates capital.
This piece is free. Share it with anyone who allocates capital, manages risk, or just wants to understand why their electricity bill is rising twice as fast as inflation.
What comes next is not.
This is the foundation for a three-part paid series that breaks down the specific investment opportunities the deficit creates, with company-level analysis, valuation frameworks, and the monitoring metrics that tell you whether each thesis is playing out or breaking down in real time.
Part 1: The Nuclear Trade. Uranium miners, enrichment bottlenecks, existing fleet valuations, the SMR pipeline, and whether the restart economics are as good as the market thinks. We flagged nuclear as deserving dedicated analysis in this piece. This is that analysis.
Part 2: Natural Gas, from Molecule to Megawatt. The commodity thesis (Henry Hub dynamics, LNG tightening, structural power sector demand) and the equities that capture it: midstream companies pivoting to pipeline-to-power, gas-weighted E&Ps repricing on electricity demand, and the behind-the-meter economics that are quietly routing around the broken grid.
Part 3: Grid Infrastructure and the Scarcity Trade. Turbine OEMs, the transformer bottleneck, T&D contractors, regulated utilities, and the pair trade I think offers the best risk-adjusted expression of the entire deficit thesis: long regulated utilities versus short merchant generators on a relative basis.
Subscribe to TSCS to get institutional-grade equity research and sector deep dives before they move from “contrarian” to “consensus.” Free subscribers get the macro. Paid subscribers get the trades.
Let’s get into it.
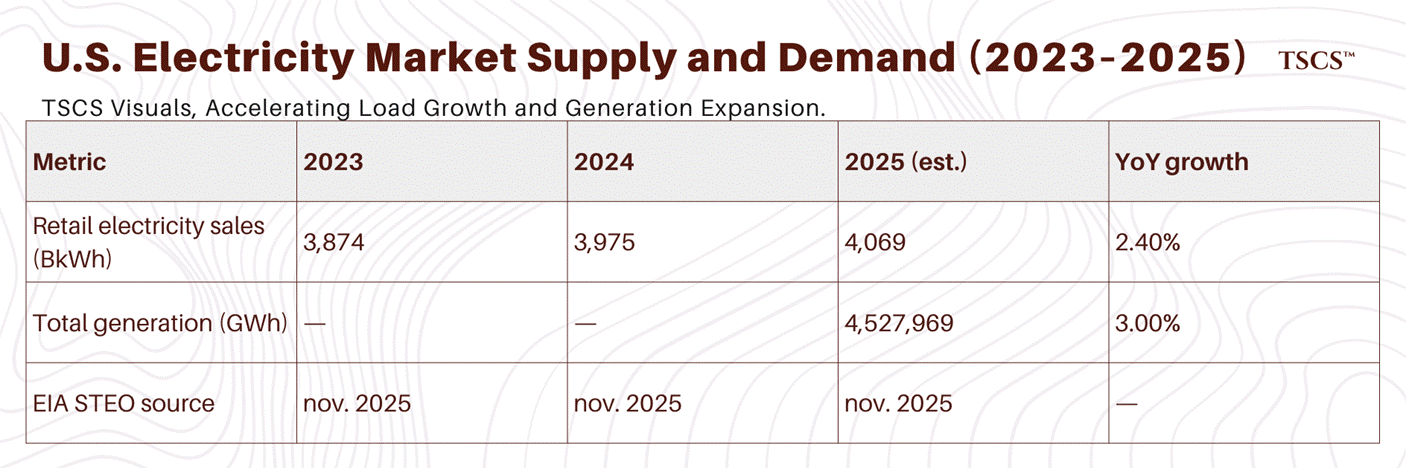
Electricity consumption hit record levels in 2025
The US consumed more electricity in 2025 than in any year in its history. Generation hit 4,527,969 GWh, up 3.0% year-over-year, the strongest growth in nearly two decades. To appreciate why this caught everyone off guard: US electricity consumption was essentially flat from 2007 to 2021. Fourteen years of zero growth. An entire generation of grid planners, regulators, and utility executives built their models, their infrastructure, and their careers around the assumption that demand growth was over. They were wrong. The EIA’s November 2025 Short-Term Energy Outlook estimated full-year 2025 retail electricity sales at approximately 4,069 billion kWh, representing +2.4% growth over 2024’s ~3,975 BkWh. The February 2026 STEO, released February 10, 2026, forecasts electricity generation growing 2% in both 2025 and 2026, with data center expansion in Texas and the mid-Atlantic identified as the primary driver.
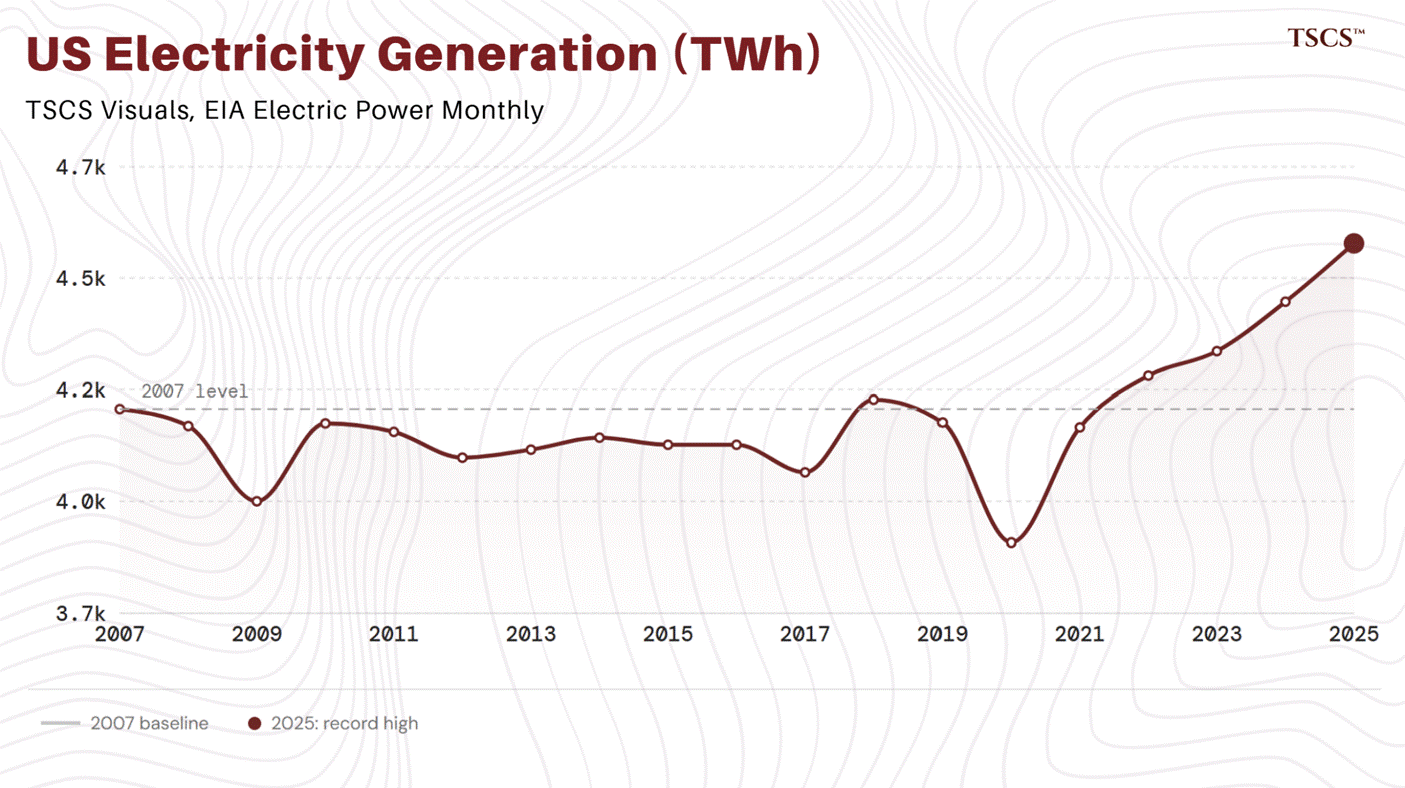
The EIA’s January 2026 STEO described this as the first four consecutive years of growth since 2005–2007, and “the strongest four-year period of growth since the turn of the century.” The December 2025 Electric Power Monthly (released February 24, 2026) showed December 2025 retail sales up 2.9% year-over-year, with the commercial sector leading at +4.6%. The EIA explicitly attributes the underlying trend to “data centers and manufacturing facilities, especially in Texas and Northern Virginia.”
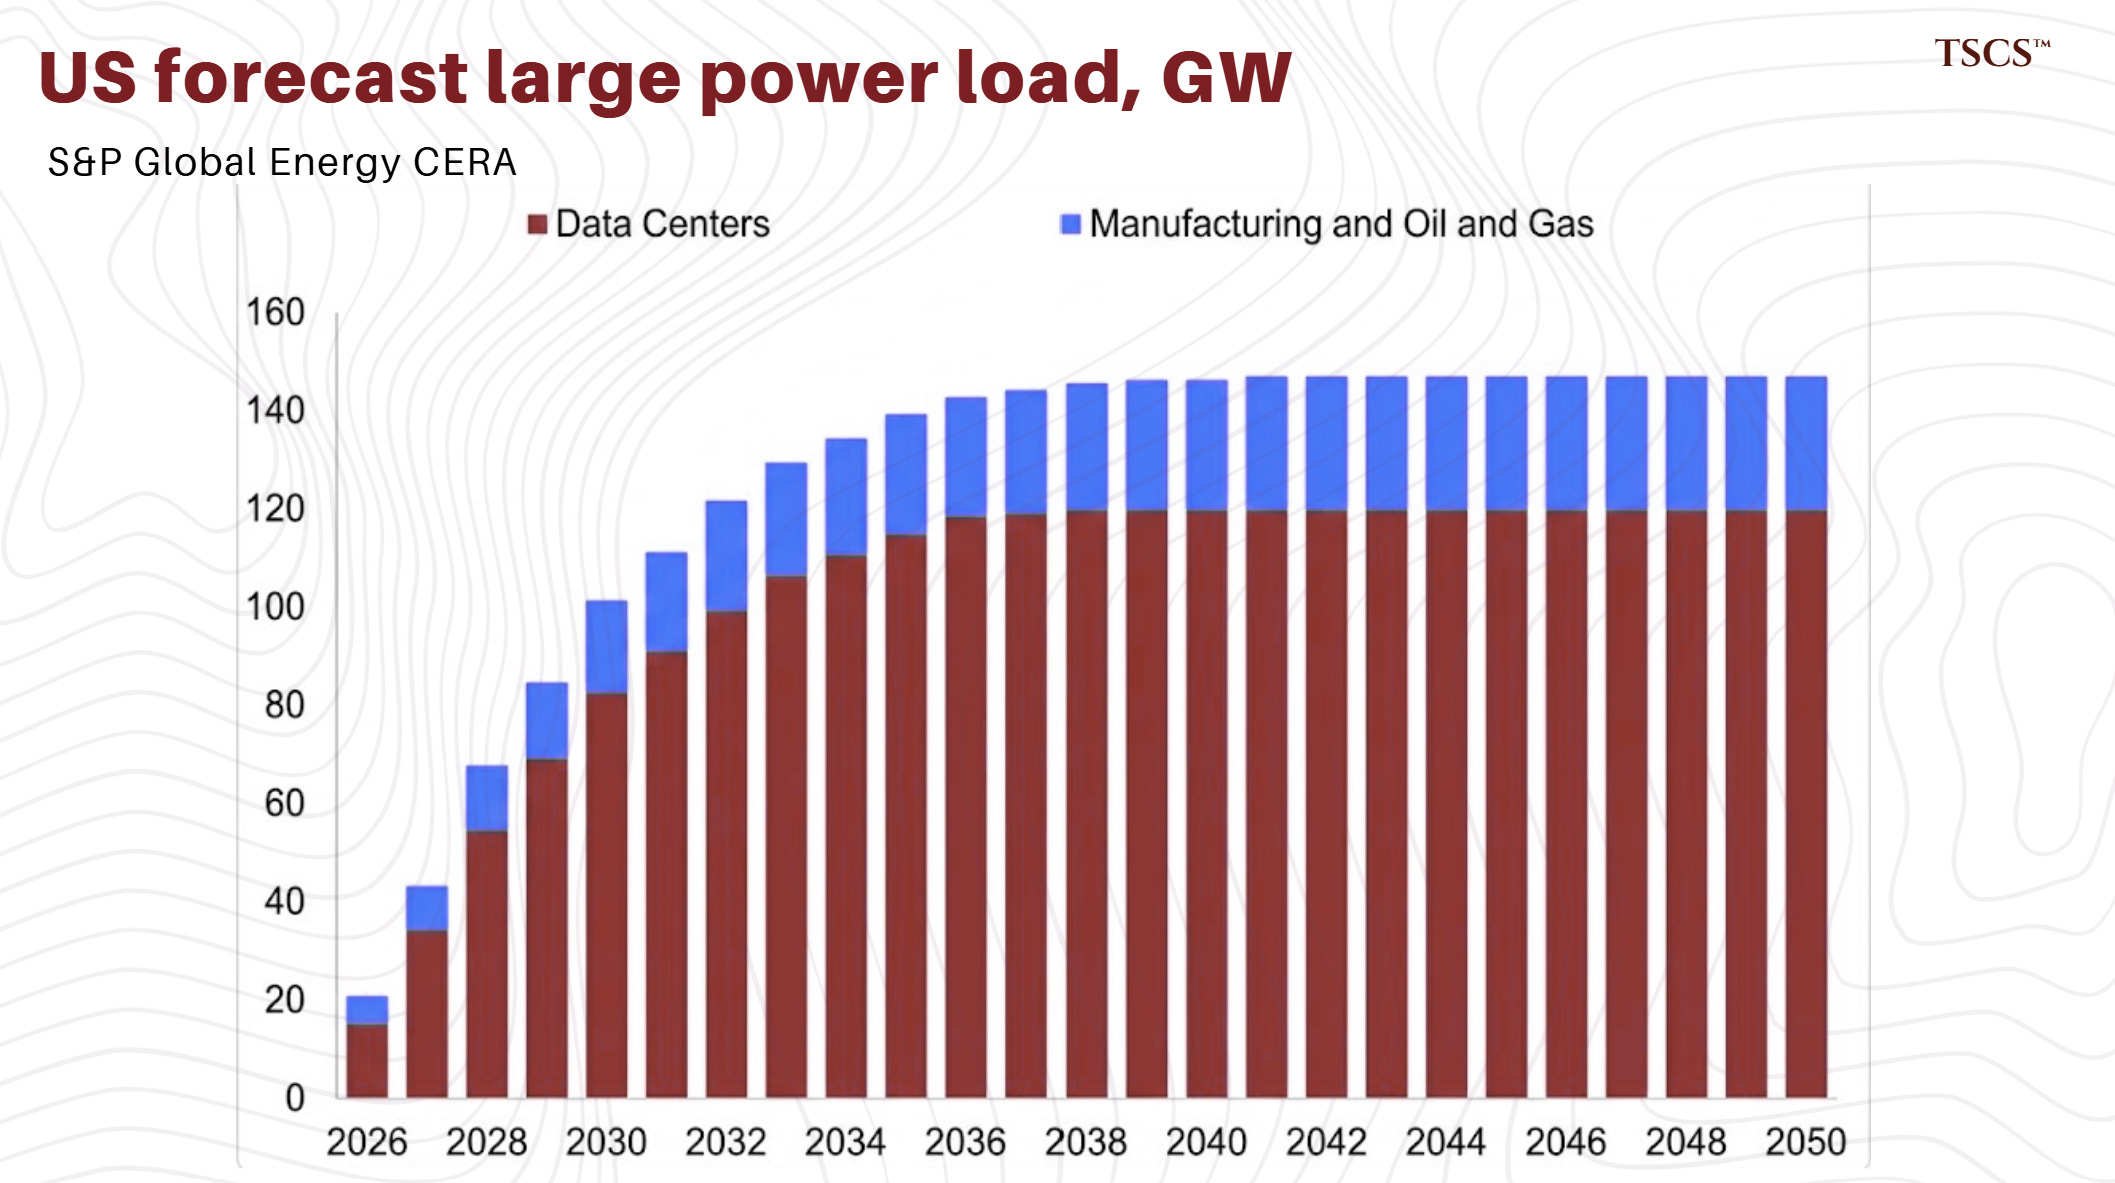
Data status: Full-year 2025 numbers remain preliminary. The EIA Electric Power Monthly now contains data through December 2025, but final annual totals may be revised. Different STEO vintages show slightly varying figures depending on when forecasts were updated. International bodies are converging on the same trajectory. The IEA reported on February 6, 2026, that data centers now account for approximately 50% of US power demand growth for the remainder of the decade, with overall US electricity demand rising at an average 2% annually from 2026 to 2030, roughly double the pace of 2016 to 2025. BloombergNEF, in a January 22, 2026 report, projected US data center power demand could reach 106 GW by 2035, a figure 36% higher than its own estimate from just nine months earlier in April 2025.
These are not minor model tweaks. The deficit is accelerating faster than the institutions tracking it can update their spreadsheets.
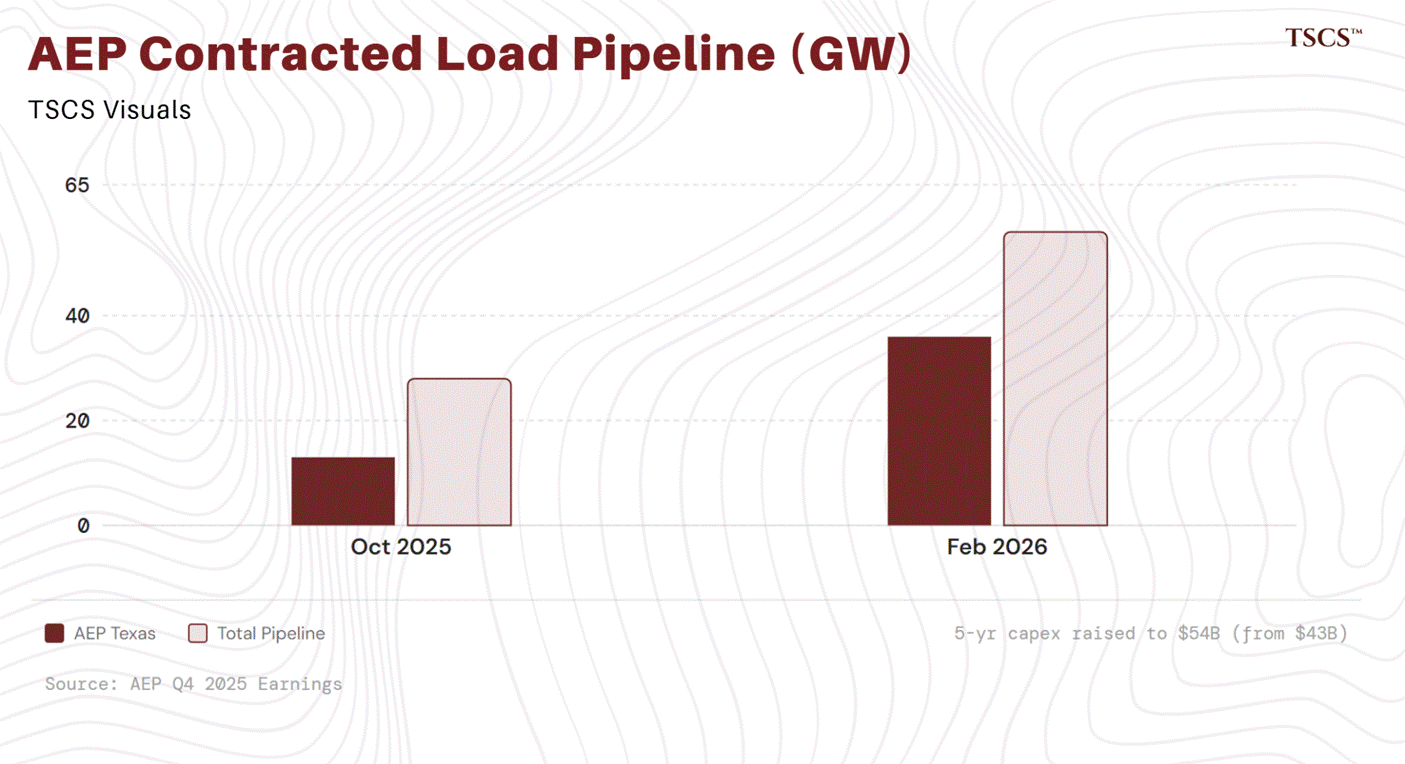
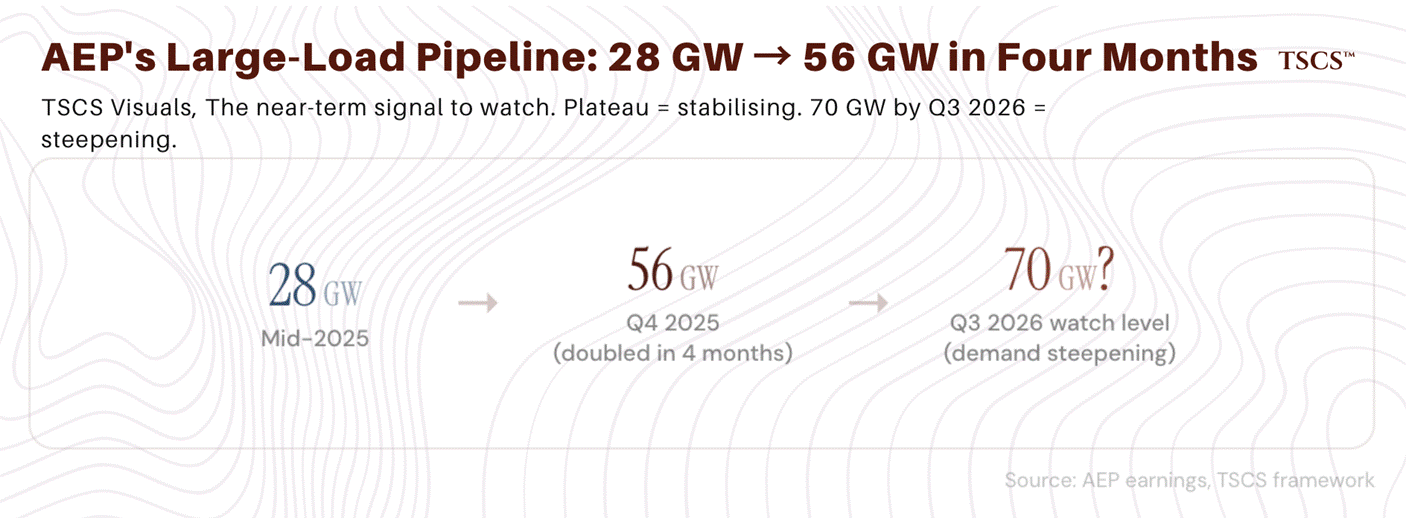
In February 2026, AEP disclosed that its contracted large-load pipeline had doubled in just four months, from 28 GW in October 2025 to 56 GW by the Q4 2025 earnings call, with AEP Texas alone jumping from 13 GW to 36 GW backed by signed hyperscaler agreements.CEO Bill Fehrman described it as ‘a generational load growth phenomenon.’ Fehrman has every incentive to talk his book here, AEP’s earnings growth is directly tied to the capex rising demand justifies, but a pipeline that doubles in a single quarter backed by executed hyperscaler contracts is difficult to dismiss as corporate optimism. AEP raised its five-year capital plan to $54 billion (from $43 billion), with investment in transmission and distribution rising 30%.
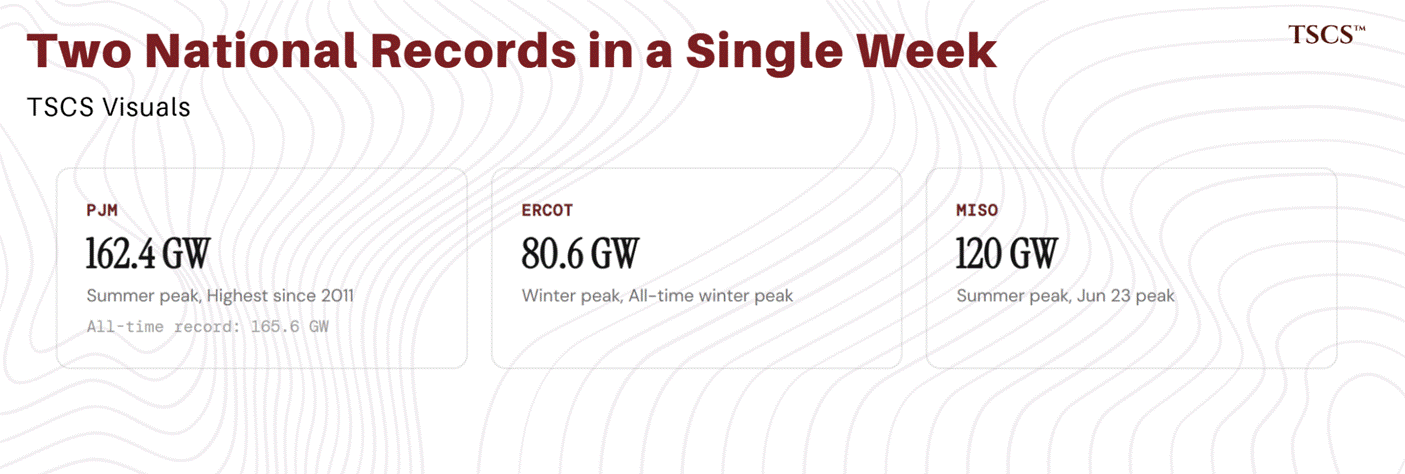
Two national peak demand records fell in a single week
The US set new coincident peak demand records twice in the final week of July 2025, per EIA’s “Today in Energy” report published August 5, 2025. On July 28, 2025, demand hit 758,053 MW (6–7 PM ET), and on July 29, 2025, it reached 759,180 MW, 1.9% above the prior record of 745,020 MW set July 15, 2024. The EIA attributed these records to hot weather combined with “an underlying trend of demand increases” from data centers and industrial facilities.
The regional picture was scarier. PJM came within 3,100 MW of its all-time 2006 record during a June heat wave, with reserves plunging to just 5 GW (below the 9.3 GW requirement) and real-time prices topping $2,100/MWh. PJM also set a new all-time winter peak of approximately 143,700 MW in January 2025. ERCOT, MISO, and ISO New England all set or approached records in the same period, with ISO-NE declaring a capacity deficiency for the first time since 2013.
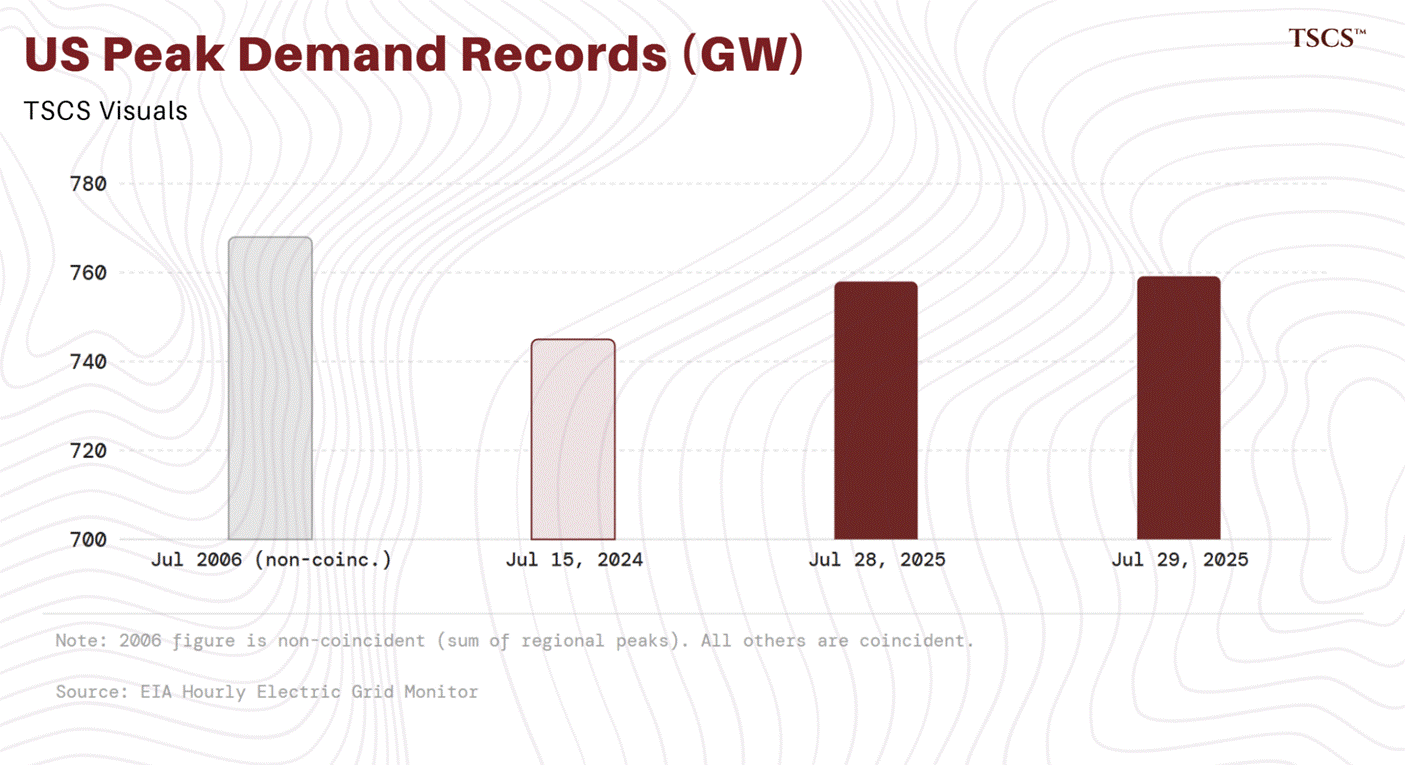
(A methodological note: the historical ~768 GW US peak from 2006 refers to non-coincident demand, the sum of each region’s individual peak at different hours. The EIA’s Hourly Electric Grid Monitor tracks coincident demand, a simultaneous snapshot. Under the coincident measure, 759,180 MW is the highest on record.)
Winter Storm Fern stress-tested the grid in real time
If the data above reads like an abstraction, you’re in for a treat. The storm struck January 23 to 27, 2026, spanning roughly 2,000 miles and triggering 24 governor emergency declarations.The storm killed at least 171 people across 24 states, making it the deadliest US winter event since Uri in 2021.
PJM issued a grid emergency on January 27 as temperatures plunged across the mid-Atlantic and reserves thinned. Energy Secretary Chris Wright issued multiple Section 202(c) emergency orders authorizing generators in ERCOT, PJM, NYISO, and ISO-NE to operate beyond normal environmental limits to prevent load shedding. Indiana’s Schahfer coal plant, which was among the facilities kept online by earlier DOE emergency retirement orders, operated above 285 MW every day from January 21 through February 1. The DOE subsequently released a fact sheet claiming it “prevented blackouts and saved American lives” during the event, noting that the emergency orders were necessary specifically because the grid lacked sufficient reserve capacity to handle a foreseeable weather event without administrative intervention.
The US grid required emergency federal intervention to avoid blackouts during a winter storm. Not a once-in-a-century event. A cold snap. The system now depends on administrative action from Washington to survive weather that it was originally engineered to handle on its own.
PJM capacity auctions signal a market in crisis
PJM’s Base Residual Auction results tell the story most concisely. The Base Residual Auction results over the past three delivery years:
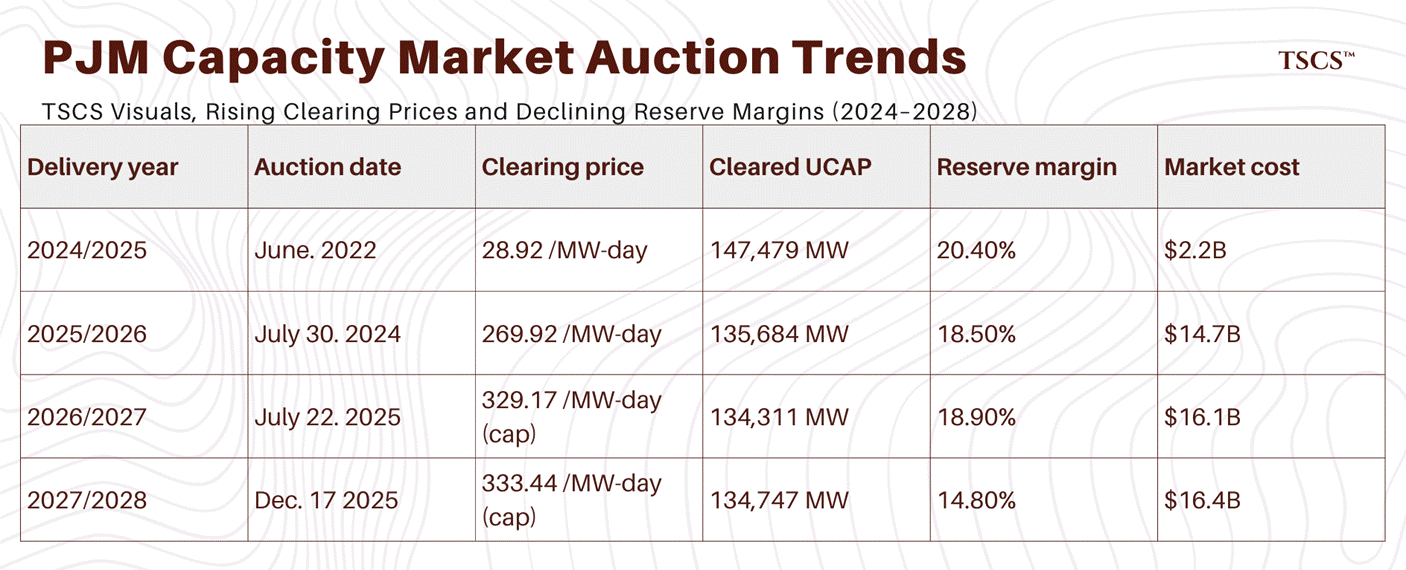
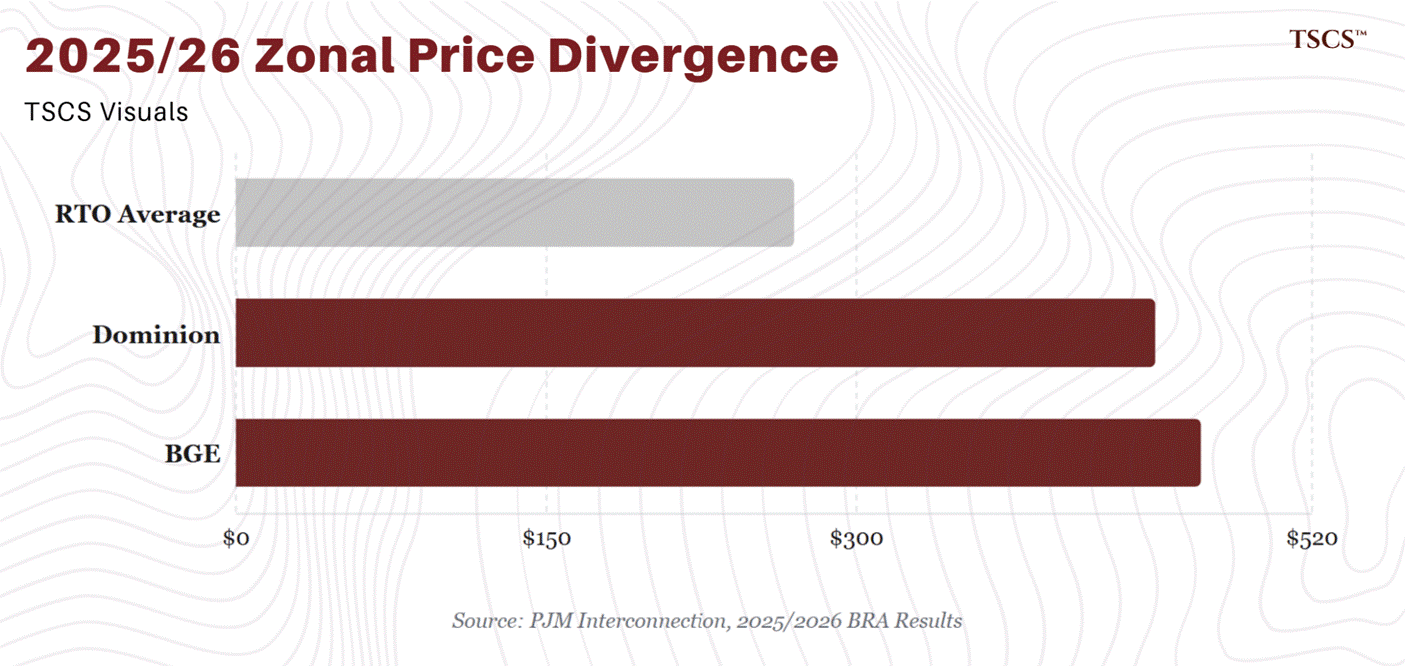
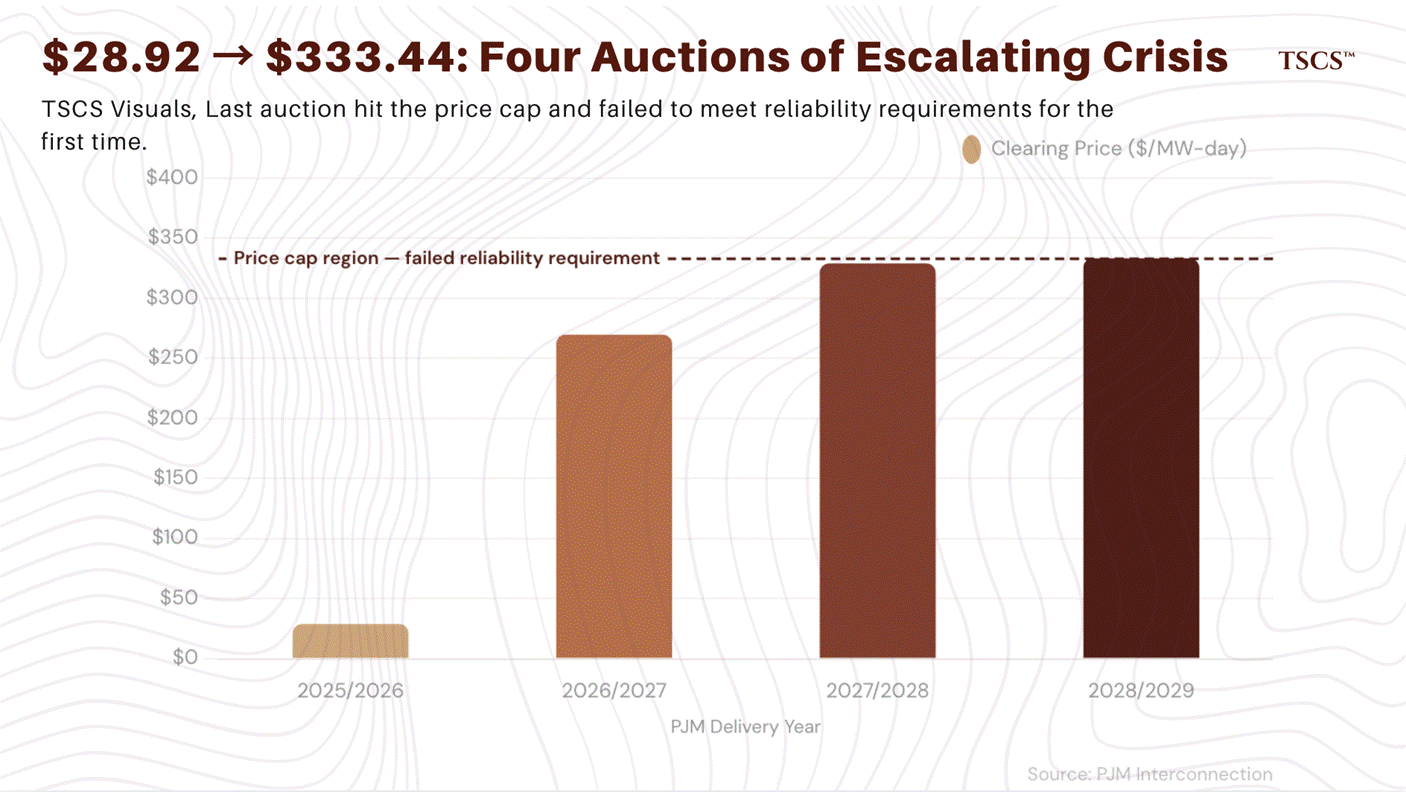
The 2025/2026 auction produced an 833% price increase in a single cycle, from $28.92 to $269.92/MW-day.
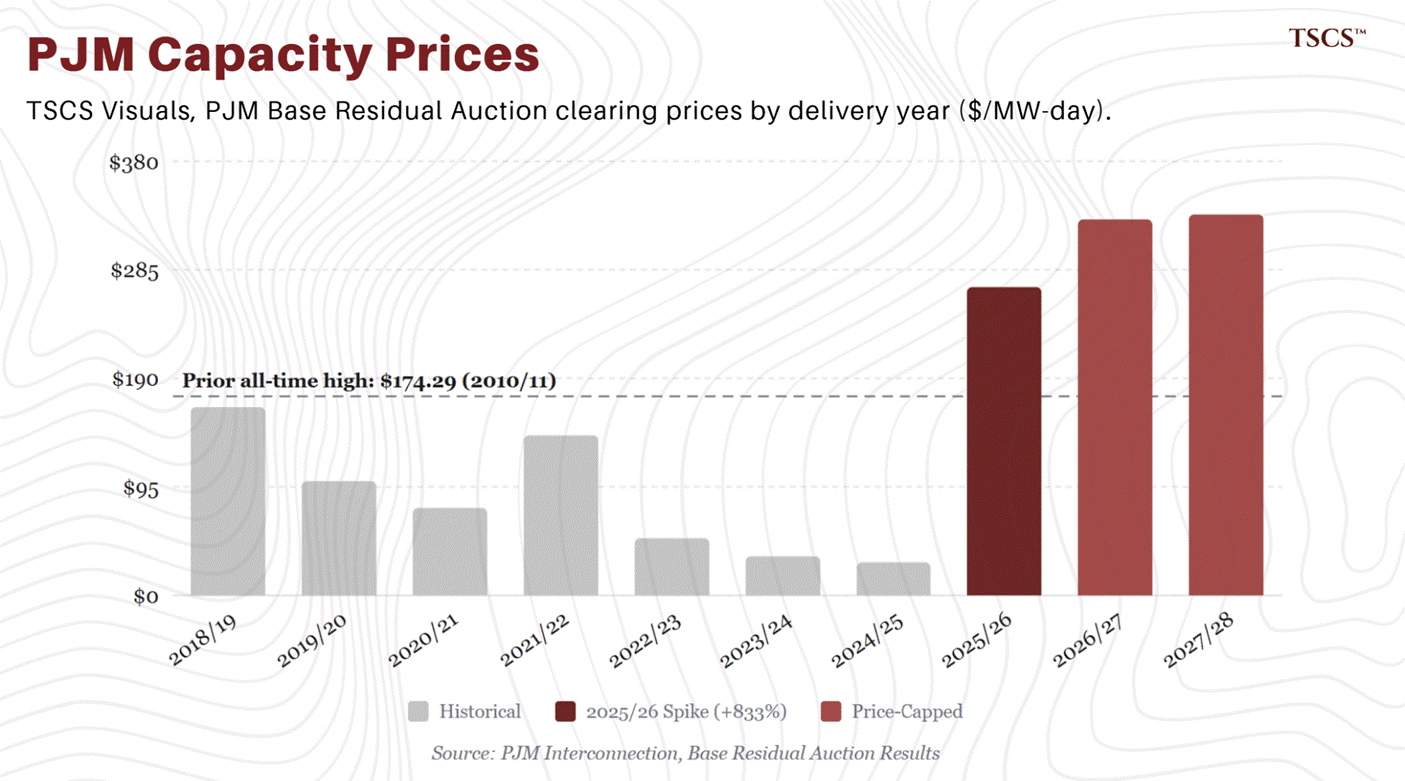
In a market that had never previously cleared above $174.29/MW-day (set for the 2010/2011 delivery year), the price nearly doubled the all-time record in one jump. Constrained zones cleared far higher: BGE at $466.35/MW-day and Dominion at $444.26/MW-day.
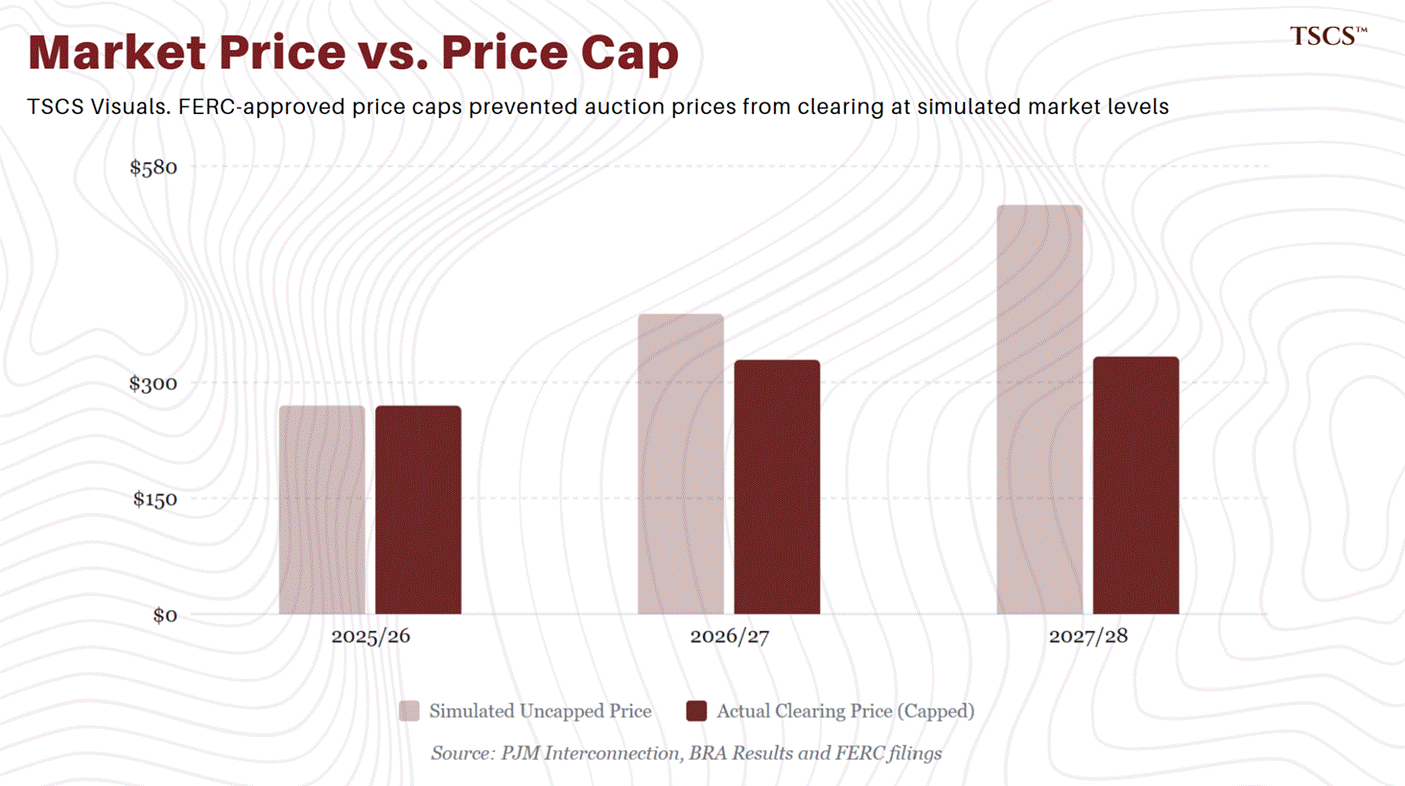
The 2026/2027 and 2027/2028 auctions both hit the FERC-approved price cap ($329.17 and $333.44/MW-day respectively). Without the cap, PJM’s simulations show the 2026/2027 auction would have cleared at $388.57/MW-day and the 2027/2028 at $529.80/MW-day, meaning the cap saved ratepayers an estimated $10 billion in the most recent auction alone.
But here is the number that should keep you up at night. The 2027/2028 delivery year auction failed to meet the reliability requirement, the first time this has occurred since the RPM capacity market’s creation in 2007. The auction achieved only a 14.8% total reserve margin (including FRR commitments) against a 20.0% target, a shortfall of 6,623 MW UCAP (8,453 MW ICAP). PJM’s tariff triggers investigation when reliability requirements are missed by more than 1%; the 5.2 percentage-point miss could trigger backstop procurement. On February 12, 2026, PJM’s Board extended the price cap for two additional delivery years (2028/2029 and 2029/2030), with bipartisan support.
Stu Bresler, PJM EVP, stated upon release of the 2027/2028 results: “This auction leaves no doubt that data centers’ demand for electricity continues to far outstrip new supply, and the solution will require concerted action involving PJM, its stakeholders, state and federal partners.”
NERC’s assessment paints the most alarming picture since 1995
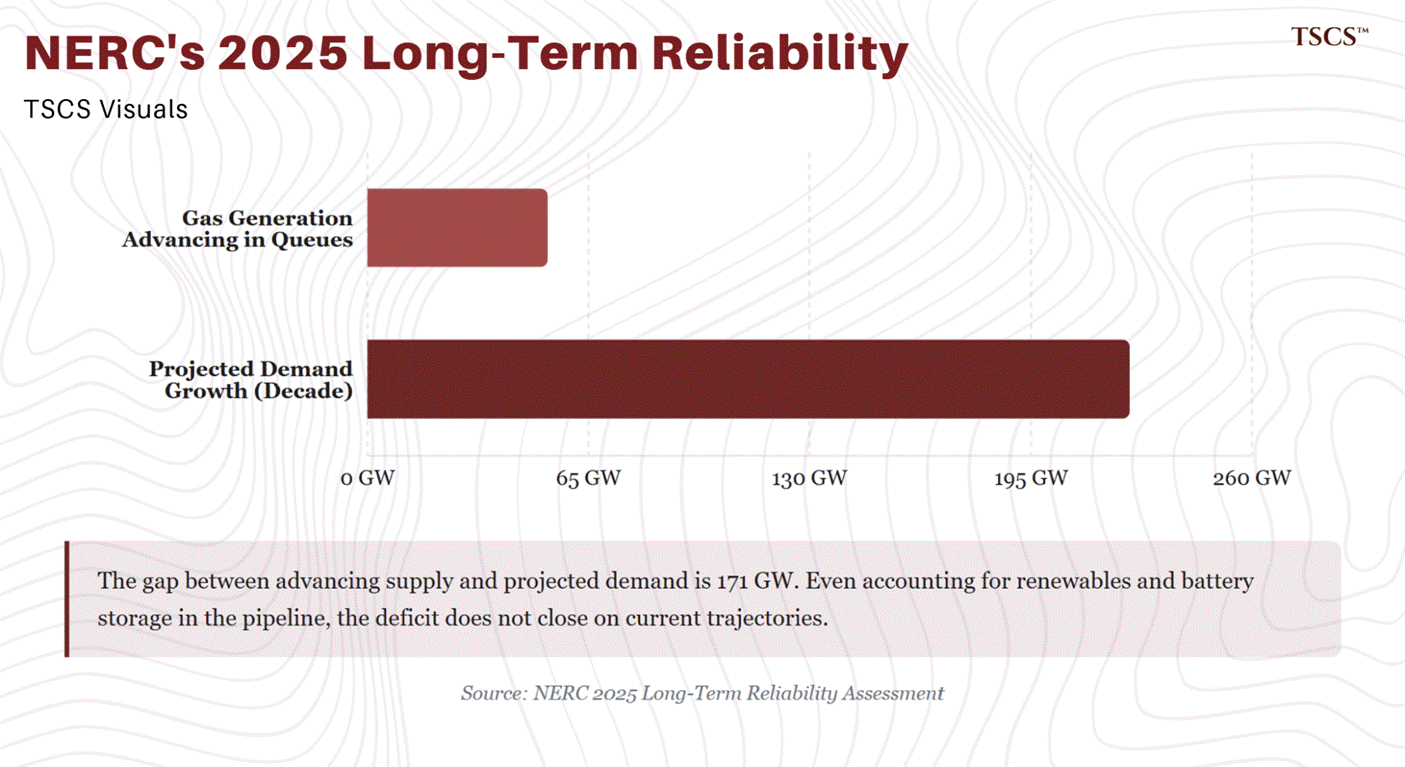
NERC is the entity whose literal job is to tell us whether the grid can keep the lights on. Its 2025 Long-Term Reliability Assessment, published January 29, 2026, opens with a blunt assessment: “The overall resource adequacy outlook for the North American BPS is worsening.”
The headline projection: summer peak demand will grow by 224 GW (29%) and winter peak demand by 245 GW (35%) over the 2026–2035 assessment period. These figures are 69% and 65% higher, respectively, than the prior year’s LTRA projections of 132 GW and 149 GW. NERC states that compound annual growth rates for both summer and winter peak demand are the highest since its tracking began in 1995.
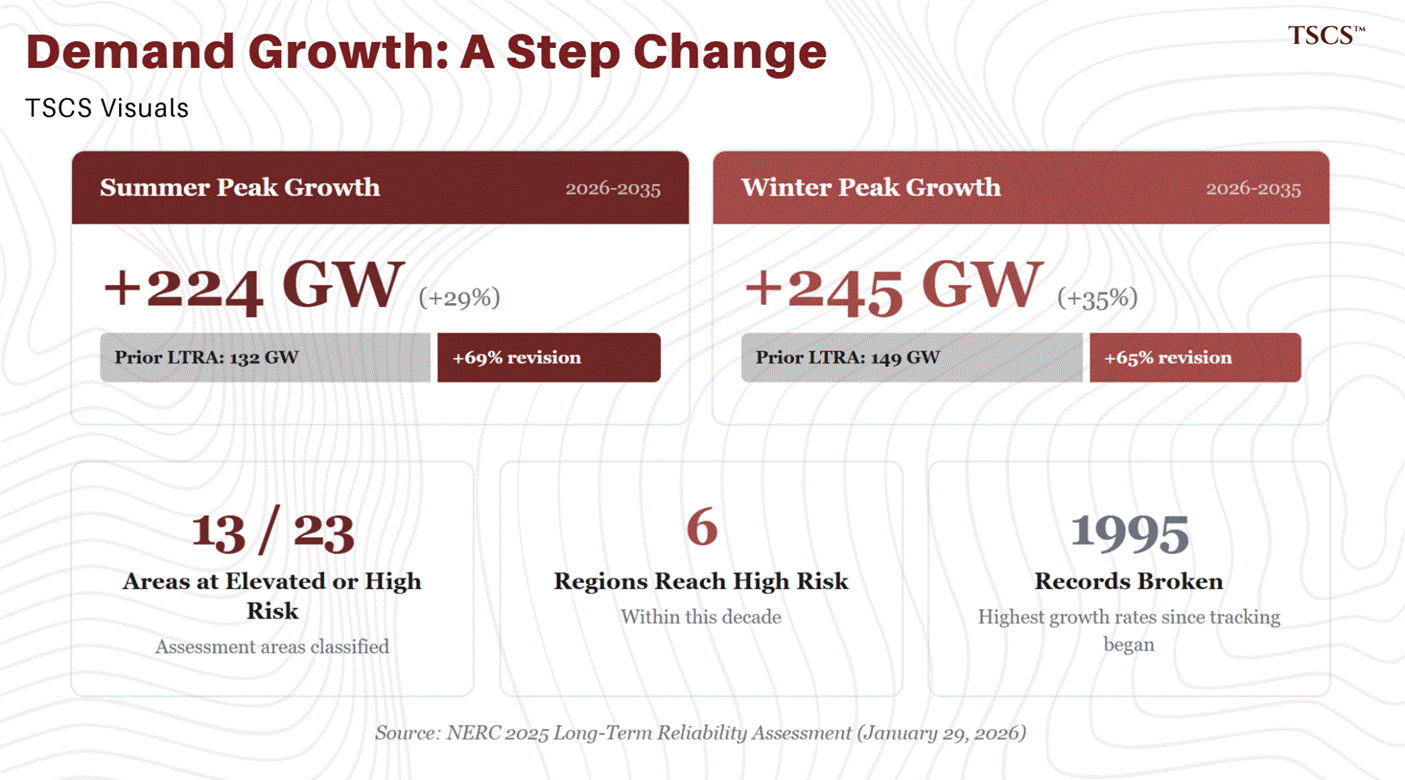
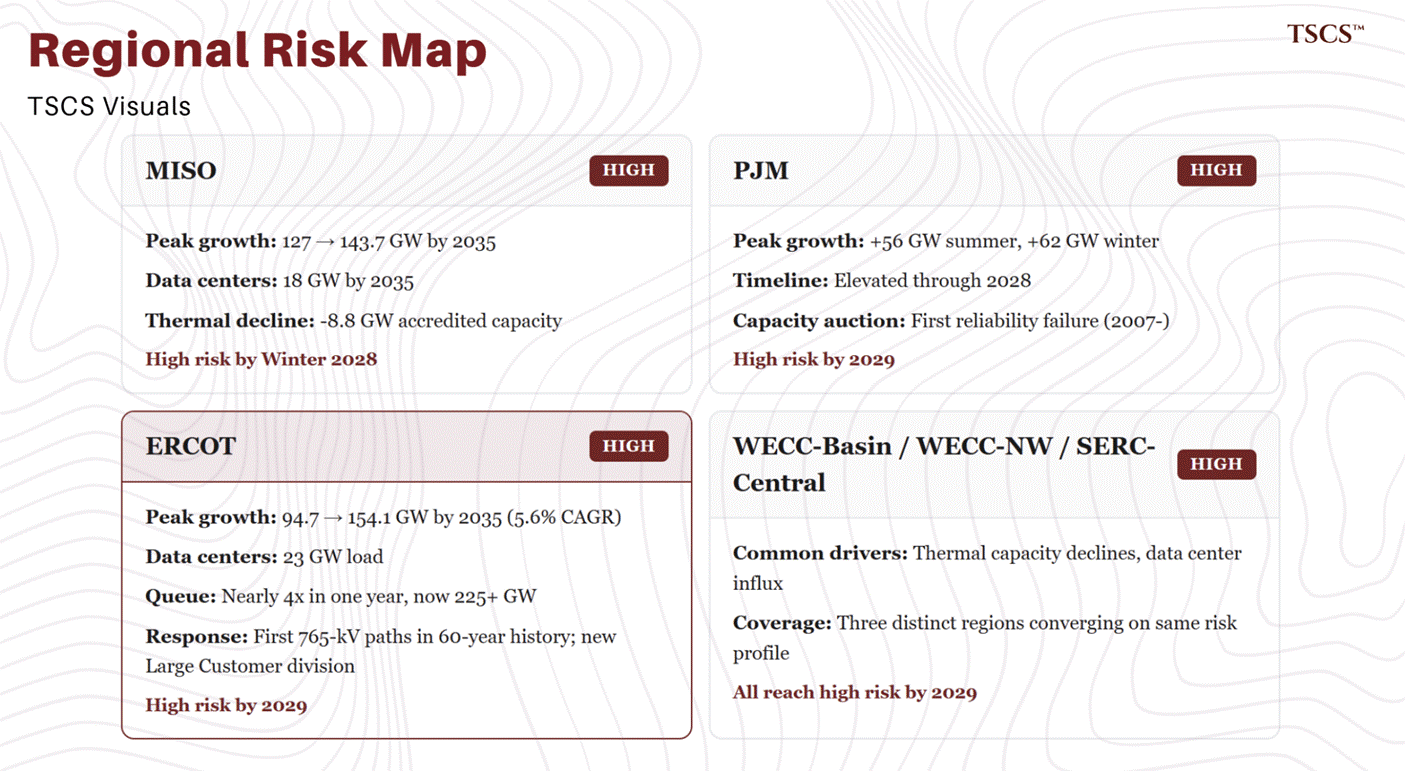
13 of 23 assessment areas are now classified at elevated or high reliability risk. Six regions face high risk within the decade:
MISO: Summer peak projected to grow from 127 GW (2026) to 143.7 GW (2035), with 18 GW of data center load by 2035. Reaches high risk by winter 2028. Accredited thermal capacity has declined by 8.8 GW.
PJM: Projects +56 GW summer and +62 GW winter peak growth by mid-2030s. Elevated risk through 2028, high risk by 2029.
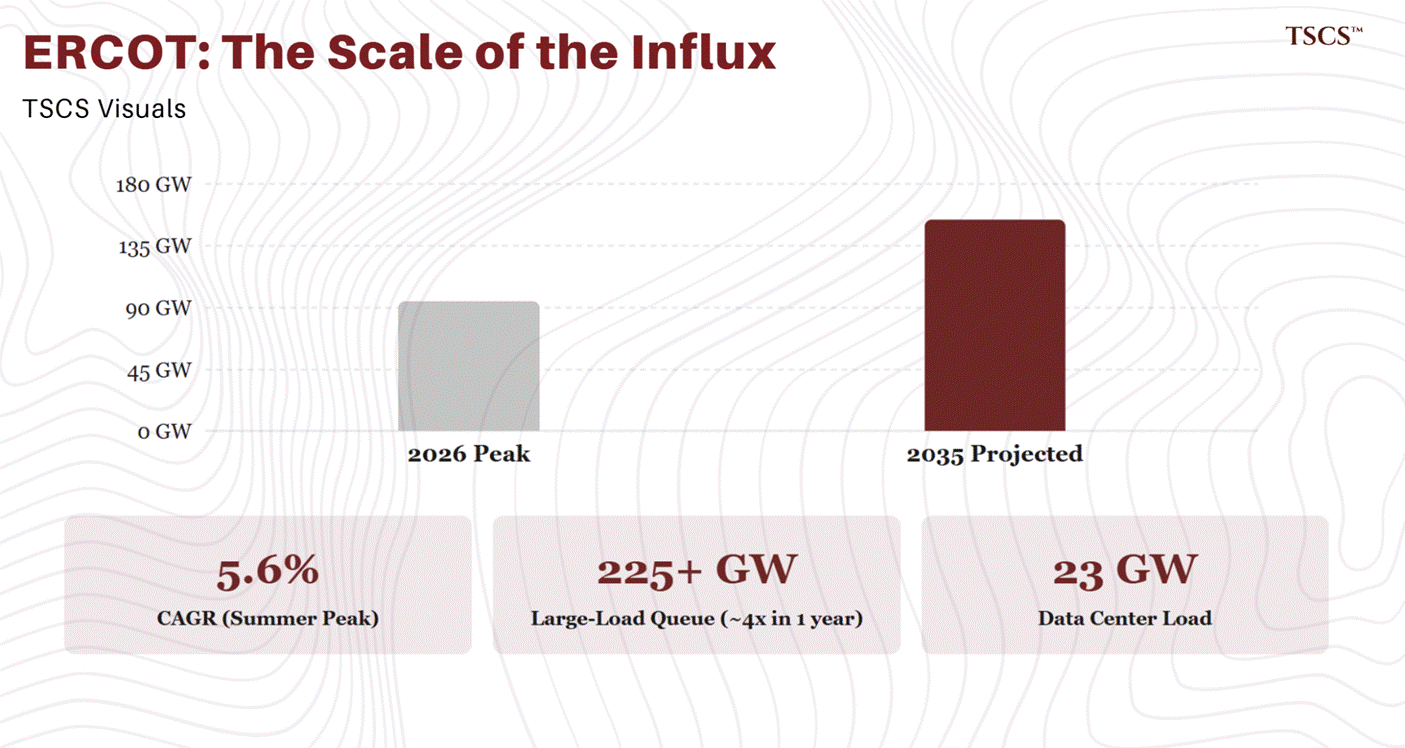
ERCOT: Summer peak projected to grow from 94.7 GW (2026) to 154.1 GW (2035), a 5.6% compound annual growth rate driven by 23 GW of data center load. ERCOT’s large-load interconnection queue has nearly quadrupled in a single year, now exceeding 225 GW. The Texas PUCT approved the first 765-kV transmission paths in ERCOT’s 60-year history in response, and ERCOT itself reorganized its management structure in December 2025, creating a dedicated Large Customer division to manage the influx. High risk by 2029.
● WECC-Basin, WECC-Northwest, SERC-Central: All reach high risk by 2029 due to thermal capacity declines and data center influx.
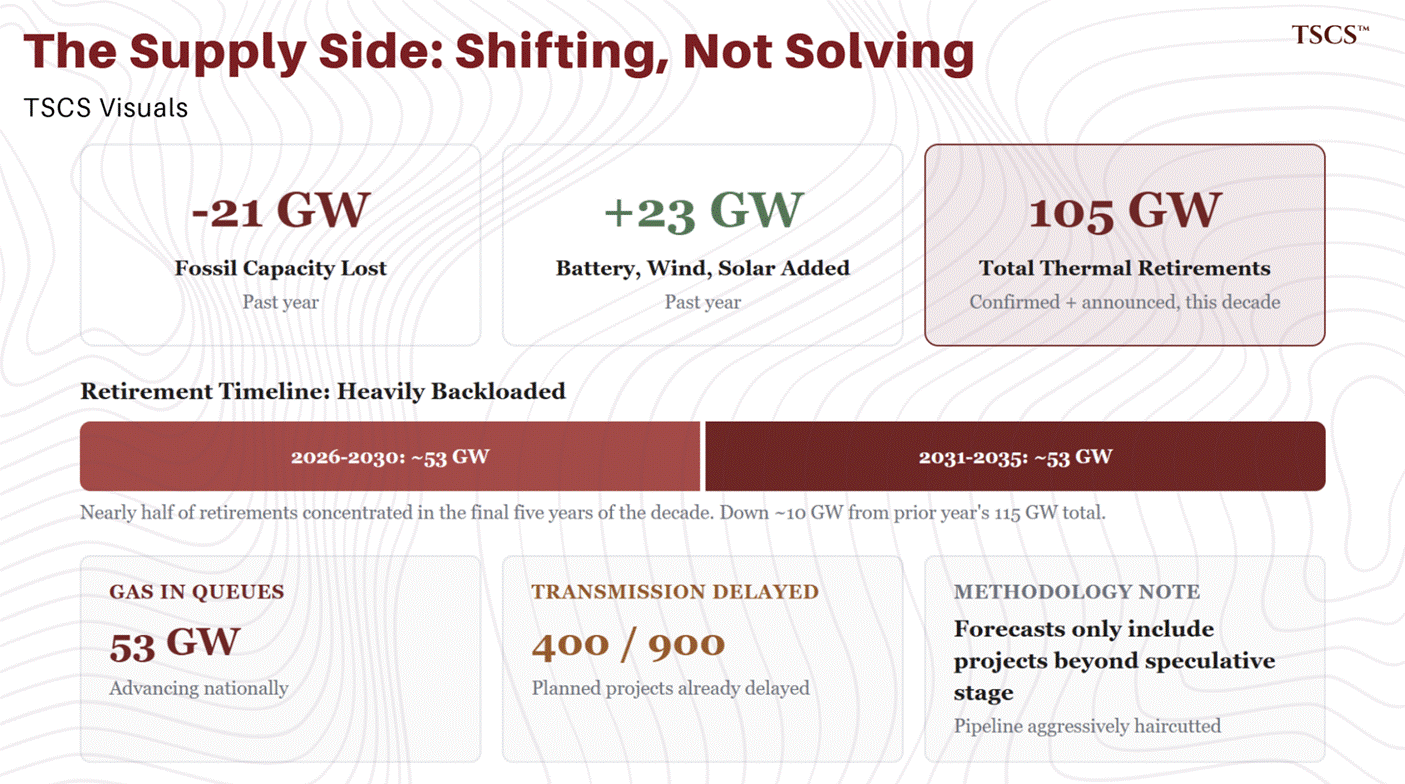
The resource mix transformation is accelerating, fossil capacity dropped by 21 GW over the past year while battery, wind, and solar increased by 23 GW, but NERC warns that total generator retirements (confirmed plus announced) reach 105 GW over the decade, down roughly 10 GW from the prior year’s 115 GW total. NERC’s Mark Olson noted during the LTRA rollout that the retirement outlook remains heavily backloaded, with nearly half concentrated in the final five years of the decade.
Only 53 GW of gas-fired generation is advancing through interconnection queues, and roughly 400 of 900 planned transmission projects are already delayed. And here is the detail that should give the optimists pause: NERC’s forecasts only include data center projects that have “advanced from speculative and exploratory stages into development commitments.” They are haircutting the pipeline aggressively, and the numbers are still terrifying.
John Moura, NERC Director of Reliability Assessment, stated: “We see real load growth... We’re not counting every prospective data center. We’re taking quite a bit of a haircut and looking at what’s reasonably expected to come in.”
Why supply cannot respond to the price signal
PJM capacity prices have risen roughly 11x in three delivery years. In any normally functioning market, that would trigger a flood of new supply. It hasn't. The reasons are structural, which means they do not self-correct on a timeline the grid can survive.
The first bottleneck is interconnection. PJM’s interconnection queue contains over 2,500 active projects totaling more than 260 GW of proposed capacity, but the average time from application to commercial operation now exceeds four years across most RTOs. The vast majority of queued projects will never be built; historically, only 15-20% of projects entering US interconnection queues reach completion. NERC’s 2025 LTRA identifies only 53 GW of gas-fired generation advancing through queues nationally, against projected demand growth of 224 GW over the decade. Even accounting for renewables and battery storage in the pipeline, the arithmetic does not close.
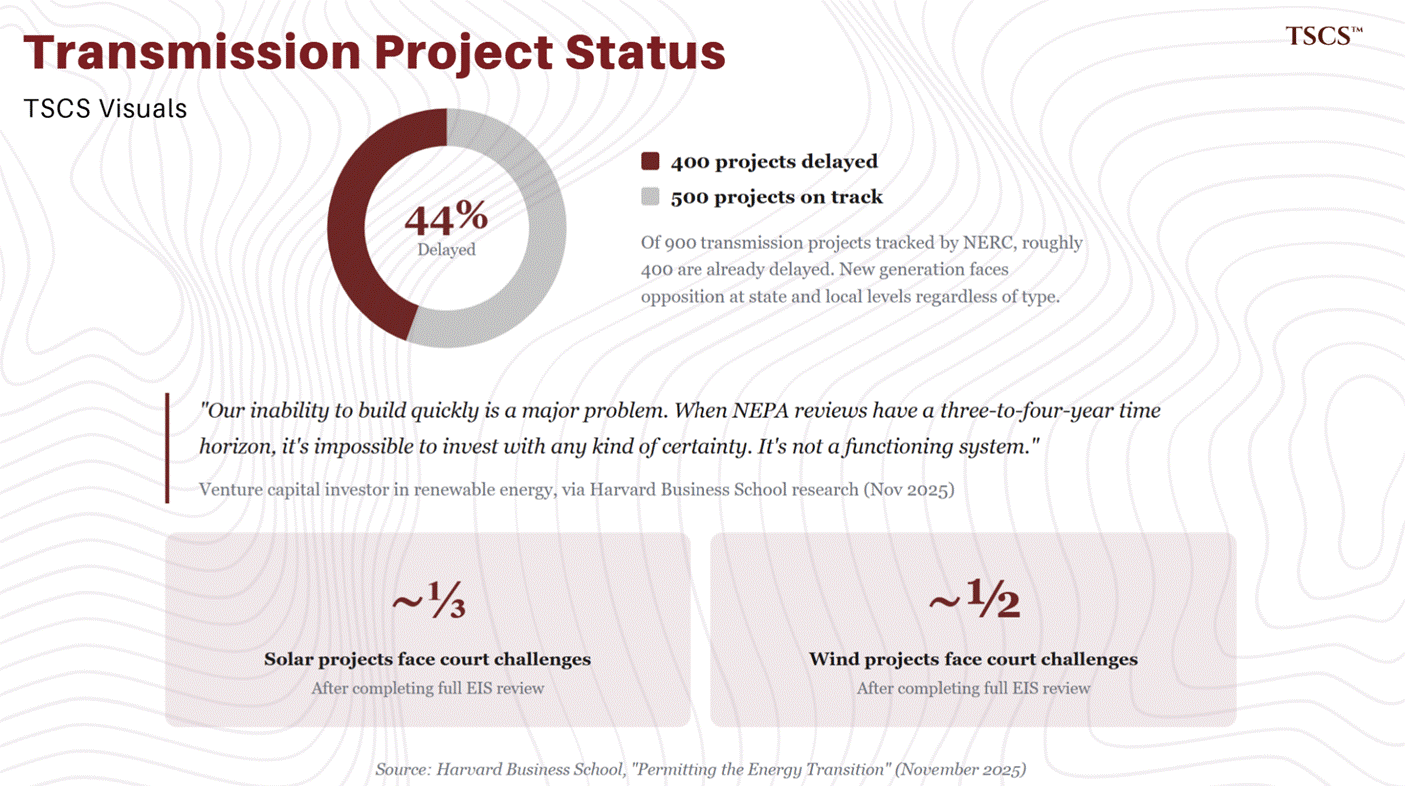
The second bottleneck is permitting and siting. Roughly 400 of the 900 transmission projects NERC tracks are already delayed, and new generation of any type faces opposition at the state and local level. The situation is straightforward: the PJM region should be able to build five or six large power plants in the next few years, and it cannot. This is not a capital constraint. Utilities and developers have access to financing.
Harvard Business School’s research on the permitting bottleneck, published November 2025, included a telling quote from a venture capital investor in renewable energy: “Our inability to build quickly is a major problem. When NEPA reviews have a three-to-four-year time horizon, it’s impossible to invest with any kind of certainty. It’s not a functioning system.”
The same research found that nearly a third of solar projects and half of wind projects that completed NEPA’s most rigorous environmental impact statement reviews subsequently faced court challenges, adding years of uncertainty after permitting was ostensibly complete. As Harvard professor Stephen Ansolabehere told the researchers: “There are at least six or seven permits that you have to get at the federal level, and then at the state level you have a whole other process.” David Young of Boston Consulting Group framed it as a competitive issue: every month spent navigating fragmented regulation is “future and current competitive advantage” lost.
RMI’s Sarah Toth Kotwis, speaking on the Kleinman Center’s Energy Policy Now podcast, described how the interconnection queue itself becomes the binding constraint on everything else: “The queue dictates the pace at which developers are able to proceed with siting, permitting, and supply chain. Once a project has gotten through the queue and obtained an interconnection agreement, there’s a lot of discretion in local permitting that increases uncertainty and often timelines for project construction.” She noted that some projects that entered PJM’s queue between 2014 and 2018 are still in the engineering and procurement phase or under construction, a decade later.
On February 18, 2026, SoftBank’s SB Energy subsidiary announced a $33 billion, 9.2 GW natural gas power plant in Portsmouth, Ohio, which would be the single largest gas-fired facility in history if completed. The project was announced alongside the US-Japan $550 billion bilateral investment pledge and explicitly framed around powering data center expansion. Yet key execution details remain unresolved: the project lacks confirmed off-takers, has not secured interconnection agreements with PJM, and faces the same permitting and siting constraints that delay everything else. Its announcement is significant less as a committed supply addition and more as a measure of the capital willing to enter the market.
The binding constraint is not capital. SoftBank just offered $33 billion. The constraint is permitting, manufacturing lead times, and regulatory throughput.
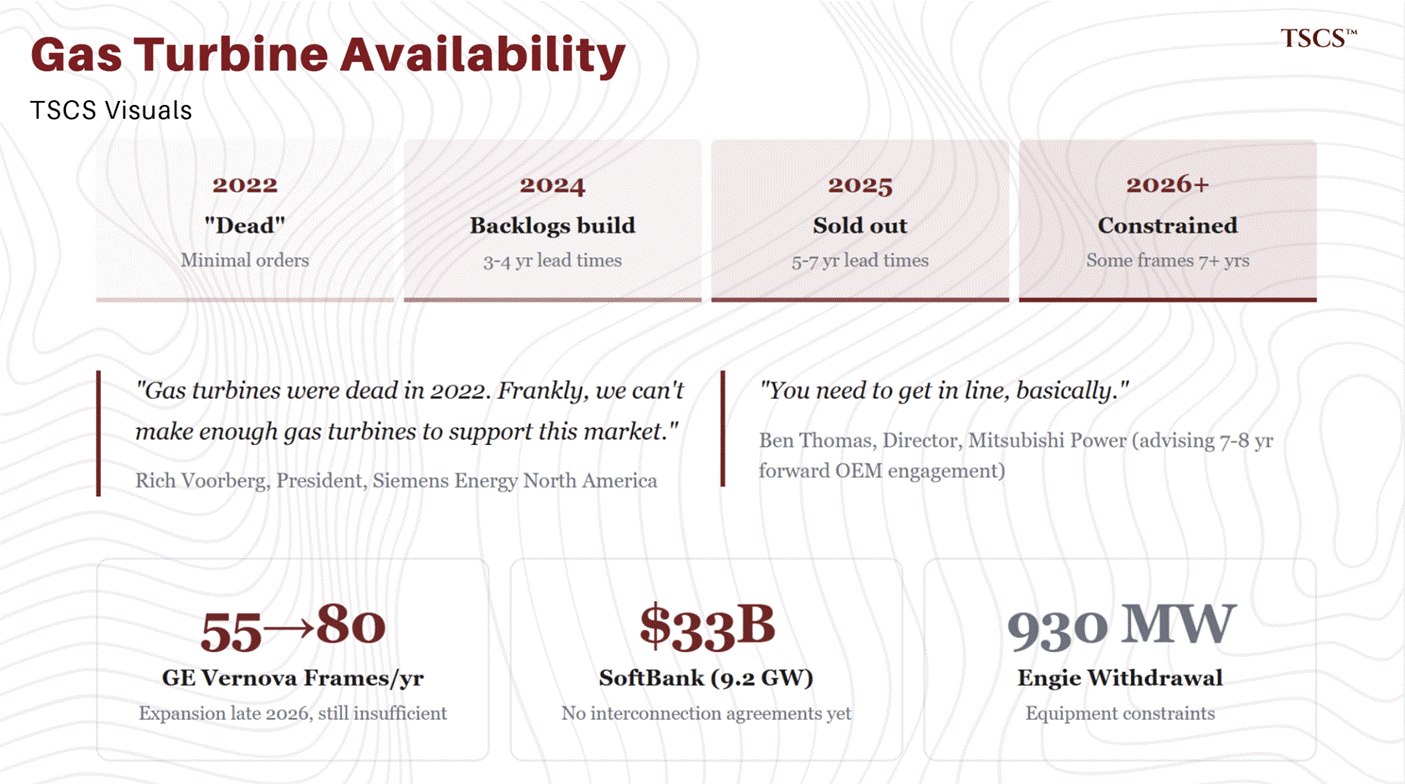
The physical reality of the supply bottleneck is visible on factory floors, not just in NERC spreadsheets. Siemens Energy North America President Rich Voorberg told the POWERGEN International audience in Dallas: “Gas turbines were dead in 2022. Frankly, we can’t make enough gas turbines to support this market. What a difference a few years make.” Lead times for large combined-cycle gas turbines have stretched to five to seven years, per S&P Global, with some Siemens frames sold out for seven years. Mitsubishi Power’s director Ben Thomas put it bluntly at the same conference: “You need to get in line, basically,” advising developers to engage OEMs seven to eight years ahead of need. In September 2025, Engie withdrew its 930 MW Perseus gas peaker project from the Texas Energy Fund, a program backed by $5 billion in state low-interest loans, citing only one reason: equipment procurement constraints. When $5 billion in subsidized state loans cannot buy you a turbine, the shortage has moved from theoretical to physical.
Google’s head of clean energy and decarbonization, Lucia Tian, confirmed the demand-side view: “Energy infrastructure takes time to build. Slots for new gas turbines are now going out to 2030.” The implication is significant: even if every regulatory and permitting obstacle were removed tomorrow, the manufacturing capacity to produce the turbines simply does not exist at the scale required. GE Vernova is expanding production from 55 heavy-frame units per year to 70 to 80 beginning in late 2026, but global demand dwarfs this capacity. Gas Turbine Hub, an industry research platform, described the situation as “a capacity-constrained future” where “the market conditions around turbines have changed more than the turbines themselves.”
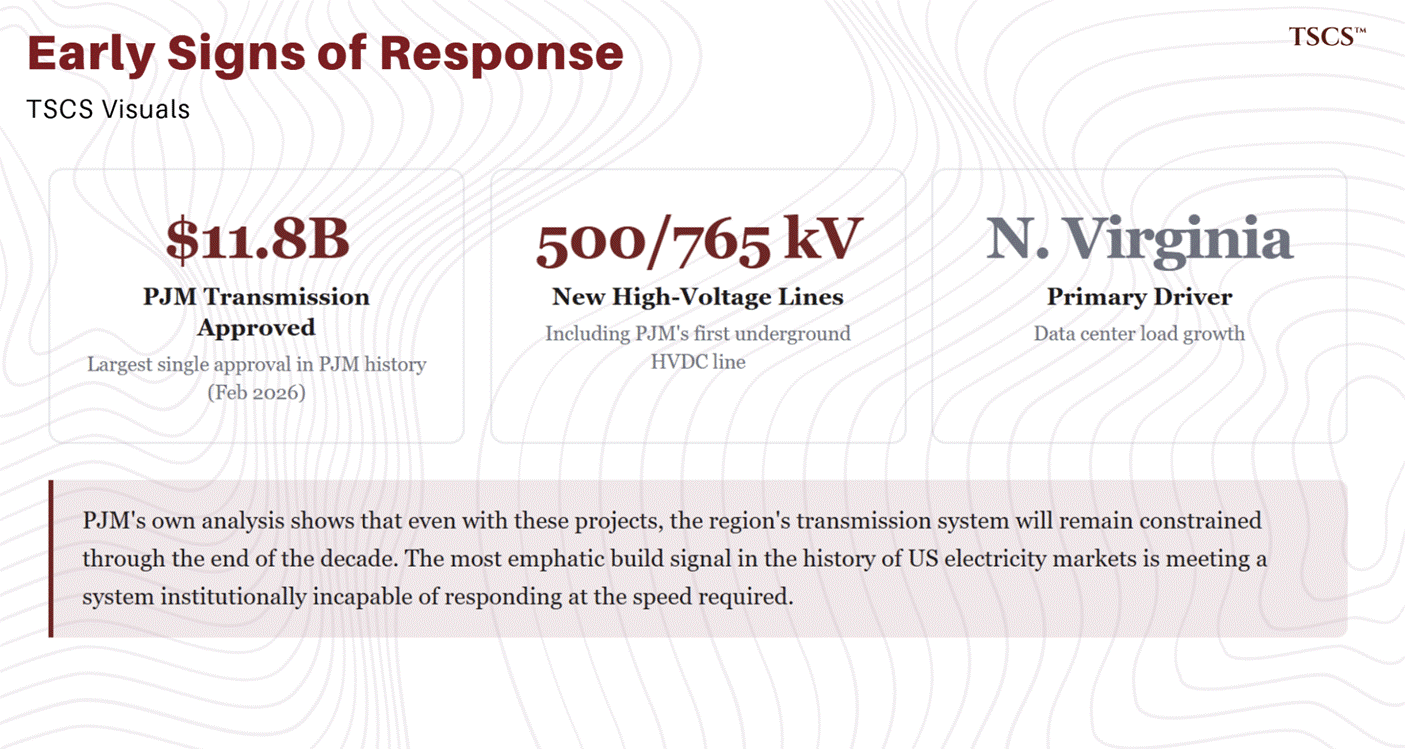
There are early signs of a transmission response, though the scale remains modest relative to the need. On February 12, 2026, PJM’s Board approved $11.8 billion in transmission projects, including new 500-kV and 765-kV lines and PJM’s first underground HVDC line, driven primarily by data center load growth in Northern Virginia. This represents the largest single transmission investment approval in PJM’s history, but covers only a fraction of the infrastructure NERC identifies as needed. PJM’s own analysis shows that even with these projects, the region’s transmission system will remain constrained through the end of the decade.
The third bottleneck is that the grid’s own market structure is accelerating retirements of the dispatchable capacity it needs most.
The 105 GW of thermal retirements flagged in the NERC section are not coincidental. In RTO-managed wholesale markets, baseload plants that self-schedule, including nuclear, coal, and combined-cycle gas, must accept whatever clearing price the auction produces. When subsidized intermittent generators bid at zero or negative prices (a rational strategy when revenue depends on production tax credits and renewable energy certificates rather than electricity sales), clearing prices can fall below the operating costs of the thermal plants the grid relies on for reliability. Over time, this dynamic renders continued operation uneconomic, and plants retire.
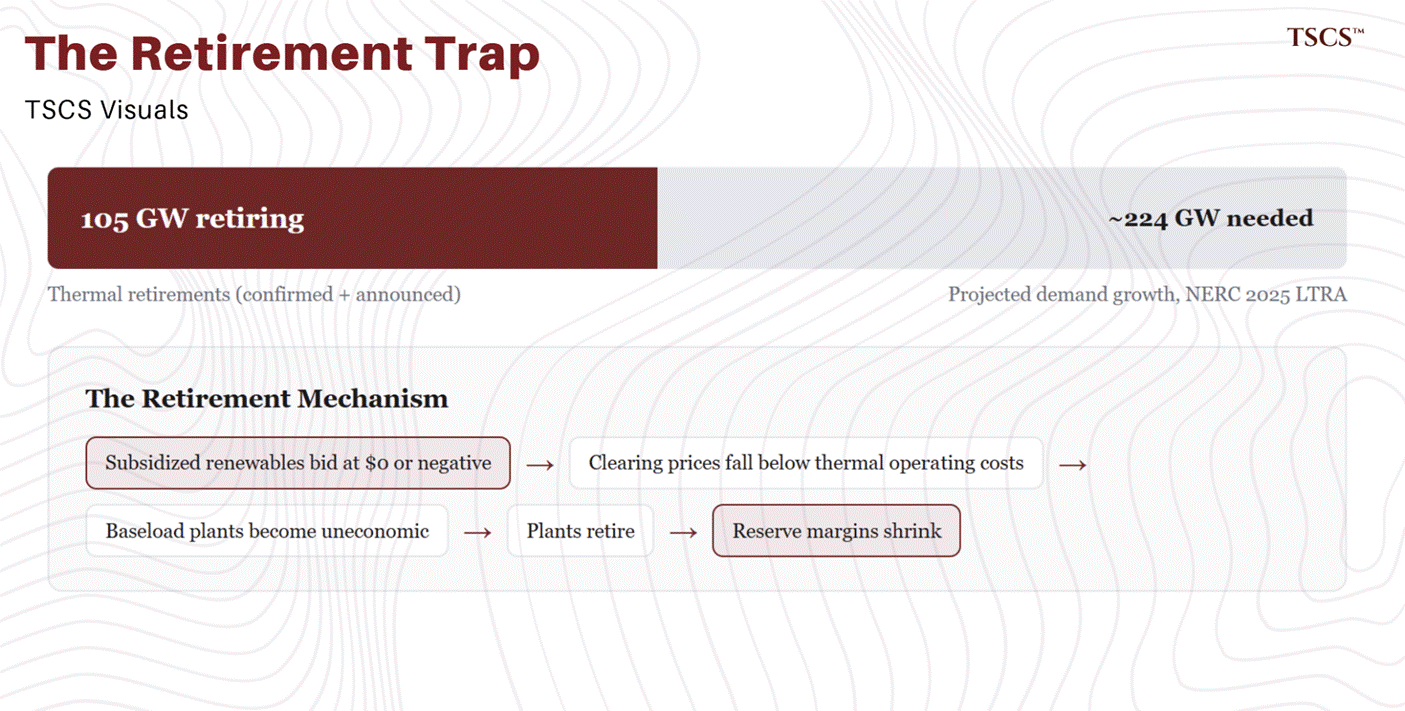
As Meredith Angwin documented in Shorting the Grid, the fundamental tension is jurisdictional: the entity that controls generator revenue (the RTO auction) has no obligation to ensure sufficient capacity exists, and the entity that approves construction (state regulators) has no control over whether the economics justify building.
The most emphatic build signal in the history of US electricity markets is meeting a system institutionally incapable of responding at the speed required. Capital is abundant. Turbines are not. Permits are not. Time is not.
The political response: federal intervention meets market structure
The bottlenecks above have done something I genuinely did not expect to write about: they have produced bipartisan consensus in American energy policy. Red-state and blue-state governors, the Trump administration, and grid operators all agree the federal government must intervene directly. What they cannot agree on is how, and the gap between those two proposals tells you almost everything you need to know about why this crisis will persist.
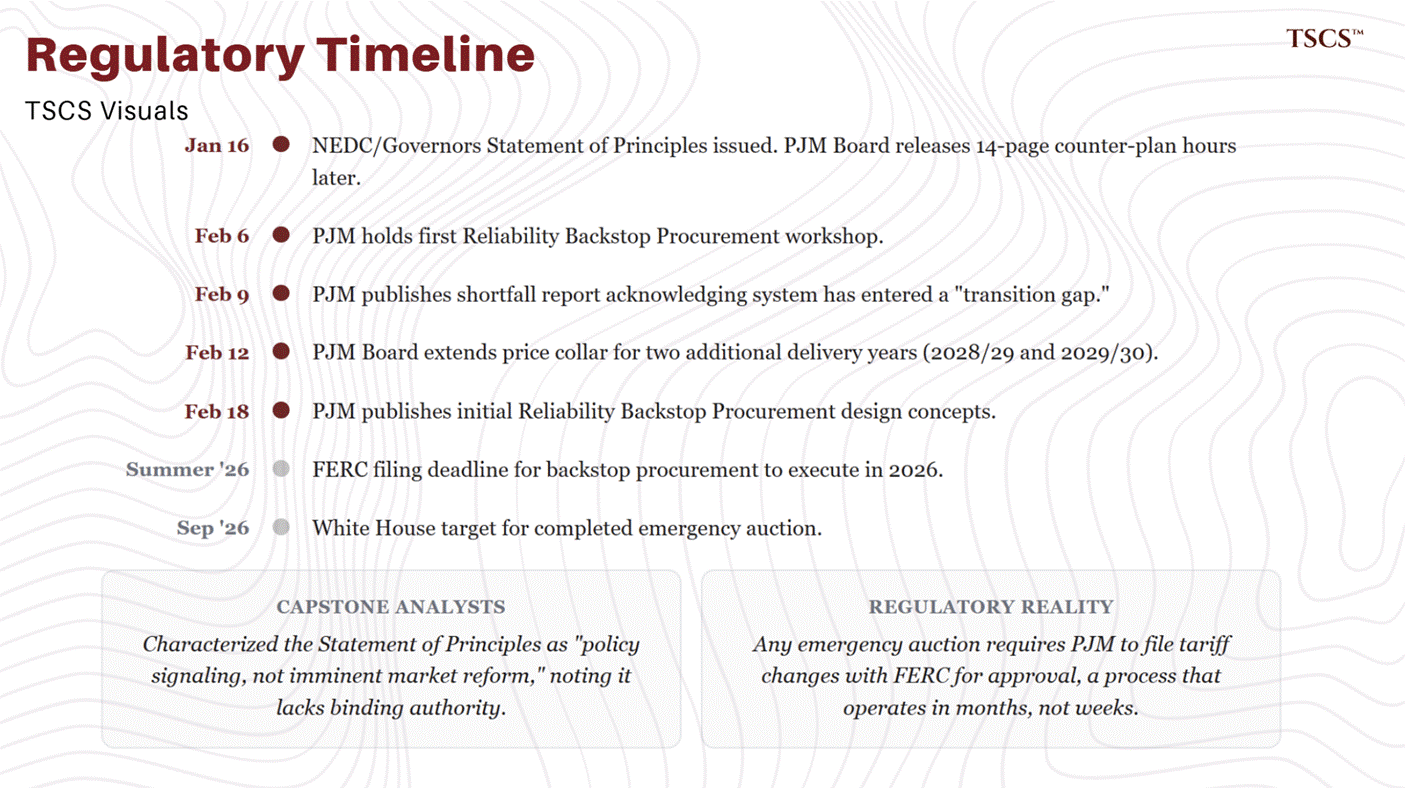
On January 16, 2026, the National Energy Dominance Council (NEDC), led by Energy Secretary Chris Wright and Interior Secretary Doug Burgum, issued a joint Statement of Principles with all 13 PJM state governors, a bipartisan coalition including Pennsylvania’s Josh Shapiro, Maryland’s Wes Moore, and Virginia’s then-Governor Glenn Youngkin. The statement was announced at a White House event attended by FERC Chairman Laura Swett. PJM itself, the entity that actually operates the grid in question, was not invited. Draw your own conclusions.
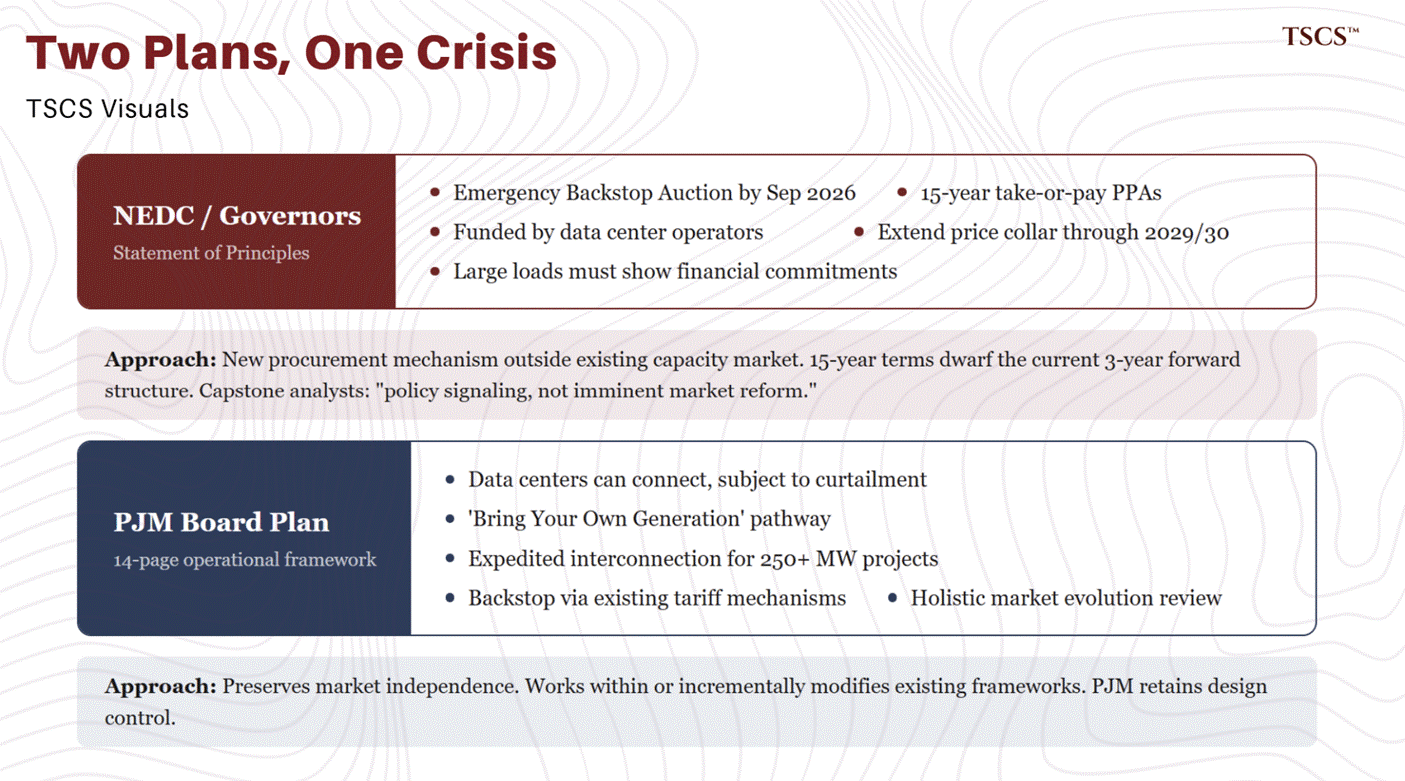
The Statement of Principles calls on PJM to conduct an emergency “Reliability Backstop Auction” by September 2026, offering 15-year take-or-pay PPAs for new generation capacity funded by data center operators. Costs would be allocated to load-serving entities with new data centers that have not self-procured capacity, with governors committing to ensure those costs flow to data centers rather than residential customers. The statement also calls for extending the existing price collar through the 2029/2030 delivery year and requiring large loads to demonstrate verifiable financial commitments before inclusion in PJM’s demand projections.
Hours after the White House event, PJM’s Board of Managers released its own 14-page plan. The substance overlapped in places, but the approach diverged significantly. PJM’s plan would allow data centers to connect without self-supplying generation but subject them to curtailment during system stress, offer a “Bring Your Own Generation” pathway to avoid curtailment, create an expedited interconnection track for state-sponsored projects of at least 250 MW, and initiate backstop procurement through existing tariff mechanisms with PJM retaining control over design. Crucially, PJM also called for a holistic review of how its energy, reserve, and capacity markets can evolve to provide appropriate investment and performance incentives.
PJM Interim President and CEO David Mills framed the plan as operational rather than political: “This is not a yes/no to data centers. This is ‘How can we do this while keeping the lights on and recognizing the impact on consumers at the same time?’”
The divergence between these two proposals is analytically significant.
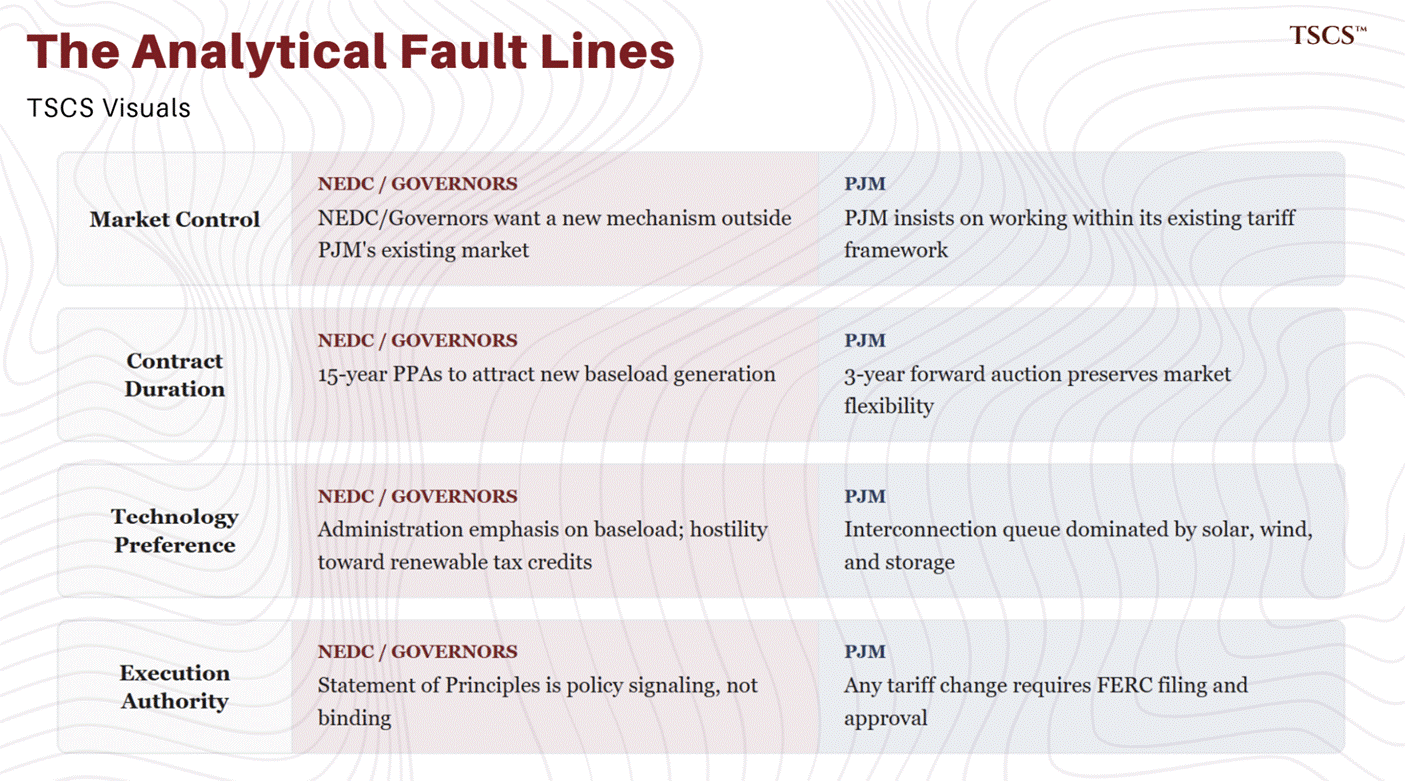
The NEDC/governors’ plan effectively asks PJM to create an entirely new procurement mechanism outside its existing capacity market, one with 15-year contract terms that dwarf the current three-year forward auction structure. PJM’s own plan preserves more market independence and works within (or incrementally modifies) existing frameworks. Capstone analysts characterized the Statement of Principles as “policy signaling, not imminent market reform,” noting it lacks binding authority.
A further complication that neither party wants to acknowledge: the administration’s emphasis on baseload generation and hostility toward renewable tax credits sits uncomfortably alongside the fact that the interconnection queue is dominated by solar, wind, and storage projects. Whatever your politics, the grid does not care about your party affiliation. It cares about megawatts. A supply response that ideologically constrains which technologies can participate will be slower and more expensive than one that lets every electron compete.
Any emergency auction requires PJM to file tariff changes with FERC for approval, a process that typically operates in months, not weeks.
Progress since January has been modest but real. PJM held its first Reliability Backstop Procurement workshop on February 6, 2026, and published initial design concepts on February 18. On February 12, PJM’s Board agreed to extend the price collar for two additional delivery years. PJM’s own shortfall report, published February 9, acknowledged the system “has entered a critical period, or ‘transition gap,’ where demand growth has temporarily outpaced infrastructure development.” A FERC filing is needed by summer 2026 for any backstop procurement to execute this year, and the White House’s September deadline for a completed auction looks, to put it diplomatically, ambitious given the regulatory cadence.
The DOE’s own assessment: 100x blackout risk
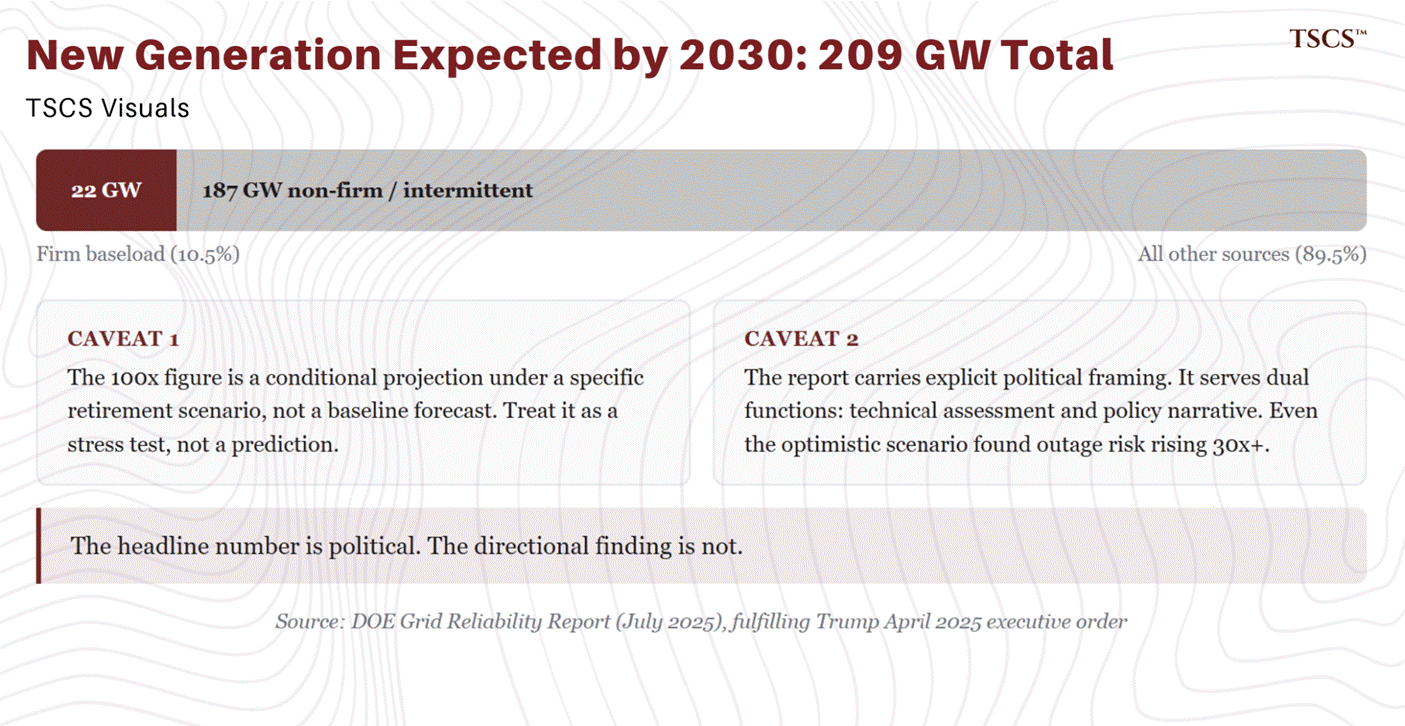
The administration’s intervention did not emerge from rhetoric alone. The DOE’s July 2025 grid reliability report, fulfilling Trump’s April 2025 executive order, modelled a stress scenario: if 104 GW of firm generation retires by 2030 without timely replacement, annual outage hours could increase roughly 100-fold. The report estimates an additional 100 GW of new peak capacity is needed by 2030, with half attributable to data centers. Of 209 GW of new generation expected by 2030, only 22 GW comes from firm baseload sources.
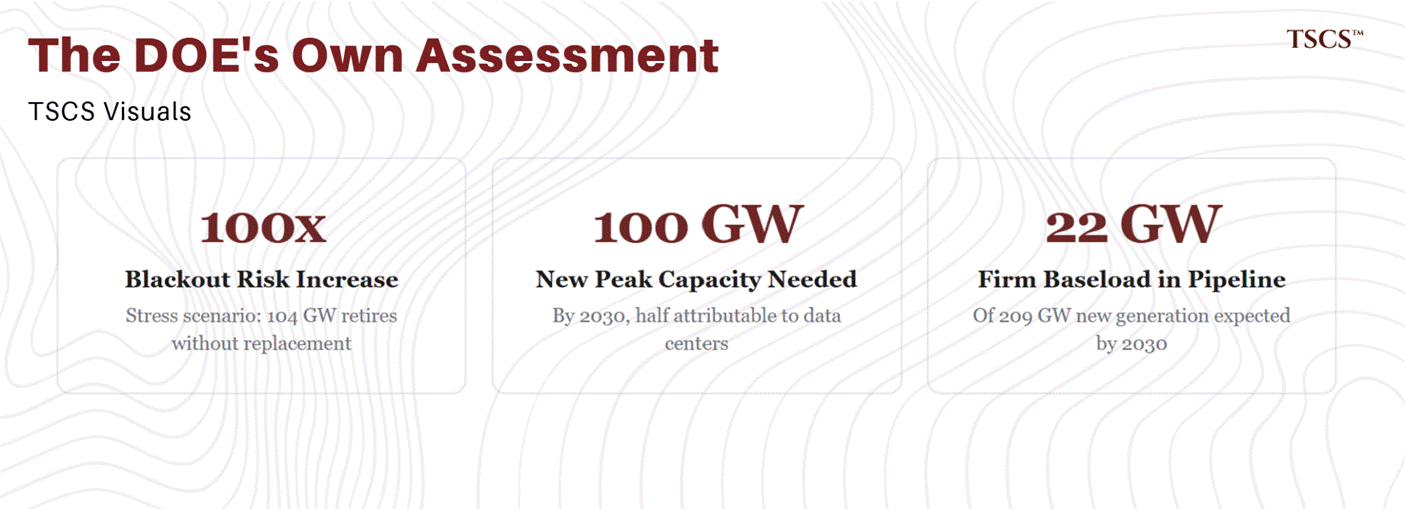
Two caveats are essential. First, the 100x figure is a conditional projection under a specific retirement scenario, not a baseline forecast; treat it as a stress test, not a prediction. Second, the report carries explicit political framing (it calls for reversing “radical green ideology”), meaning it serves dual functions: technical assessment and policy narrative. Clean energy groups have argued the analysis is overly pessimistic about advanced energy technologies. But even the report’s optimistic scenario, assuming zero retirements, found outage risk rising more than 30-fold in several regions. The headline number is political. The directional finding is not.
In September 2025, the DOE followed up by launching the “Speed to Power” initiative, a federal effort to accelerate large-scale grid infrastructure development for both transmission and generation, explicitly framed around maintaining US competitiveness in the AI race.
The structural divide: why the Southeast is building and PJM is not
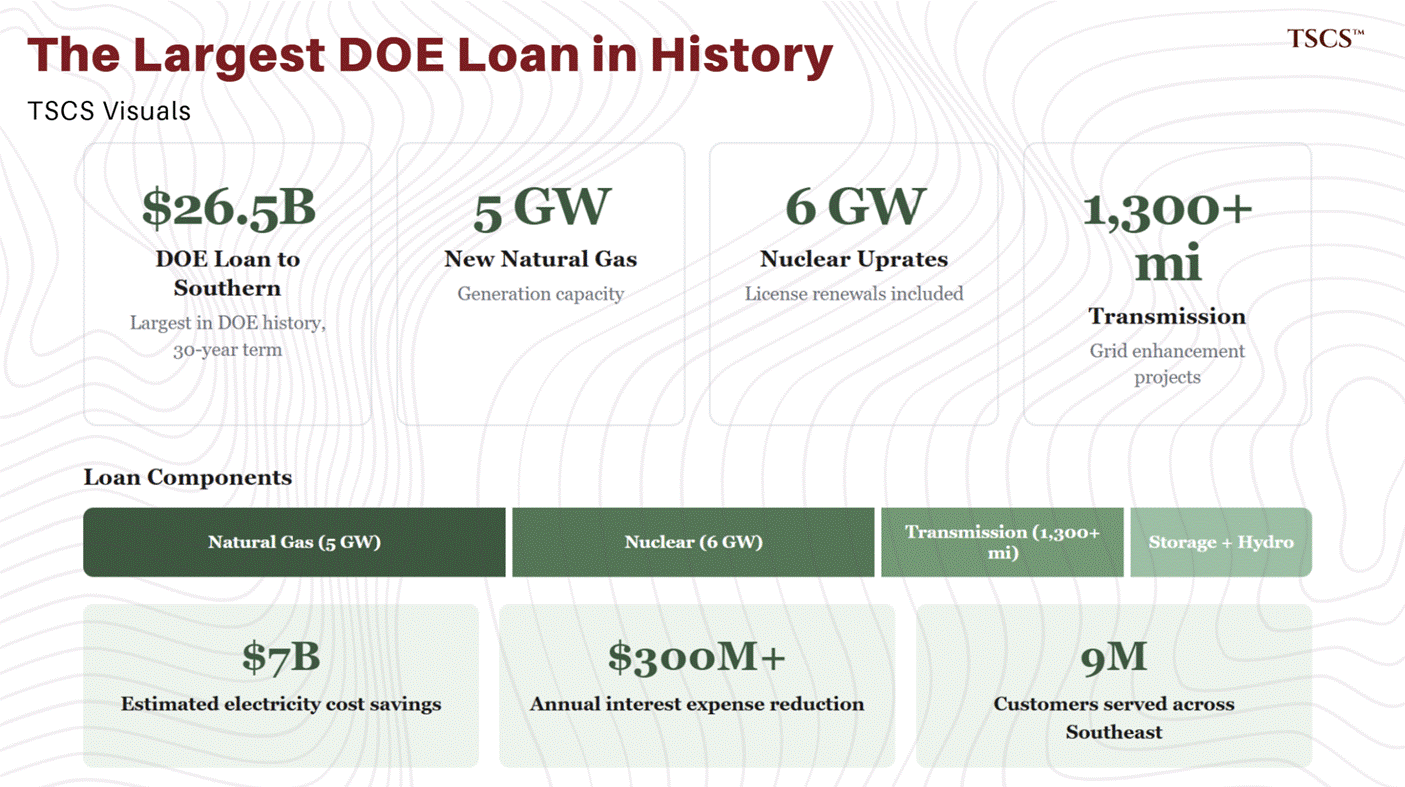
On February 25, 2026, the DOE closed the largest loan in its history: a $26.5 billion package to Southern Company’s Georgia Power and Alabama Power subsidiaries. The 30-year loans will finance 5 GW of new natural gas generation, 6 GW of nuclear uprates and license renewals, hydropower modernization, battery energy storage, and over 1,300 miles of transmission and grid enhancement projects.
(A note on nuclear: the DOE loan to Southern includes nuclear uprates and license renewals, and SMR development is advancing through NRC licensing, though on timelines measured in years, not quarters. Nuclear’s role in the grid deficit, from SMRs to new-build economics to the regulatory pathway, deserves dedicated analysis, which we will publish separately. For this piece, the relevant point is narrower: existing nuclear assets are uniquely valuable in a deficit environment because they provide 24/7 carbon-free baseload power that cannot be replicated at scale by any other source on a five-year timeline.)
The DOE estimates the loans will deliver $7 billion in electricity cost savings and reduce Southern’s interest expenses by over $300 million annually. Southern, which serves 9 million customers across the Southeast, recently raised its five-year investment plan to $81 billion.
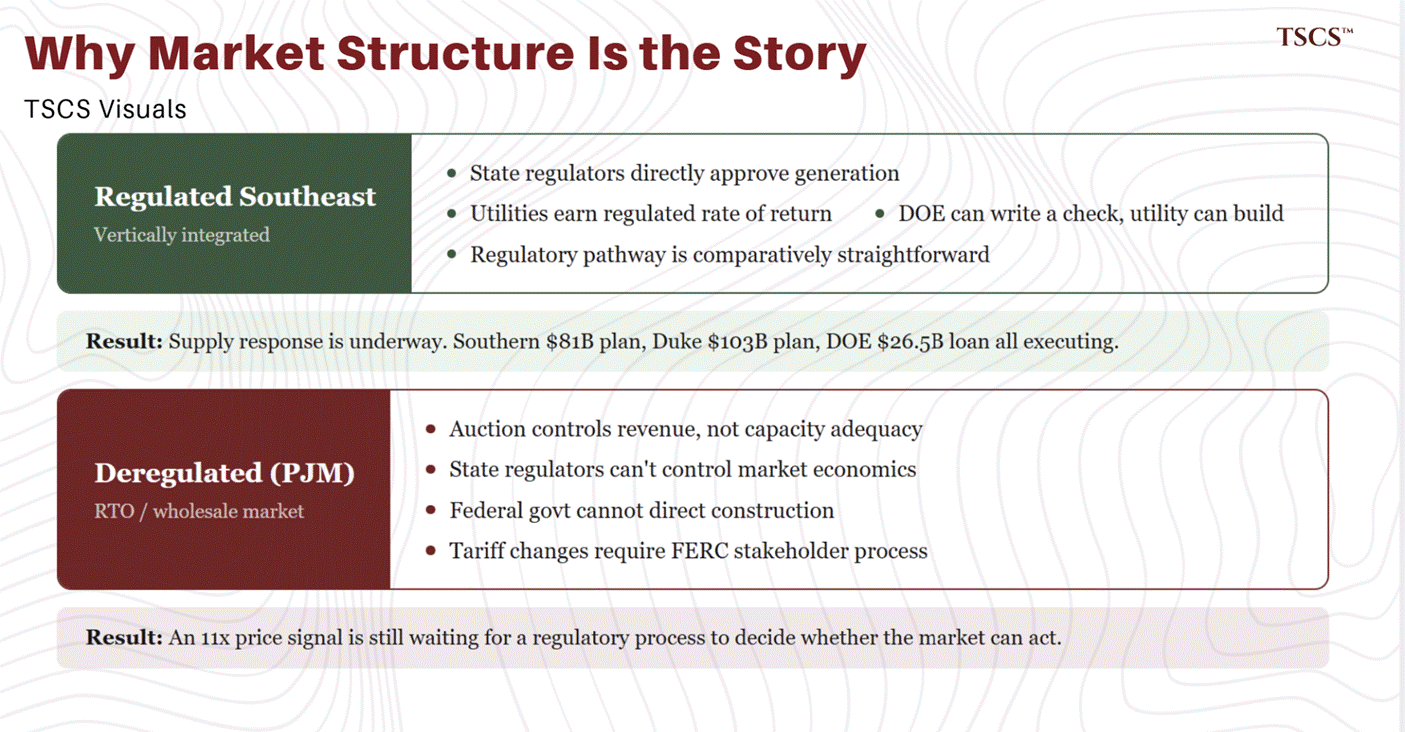
The $26.5 billion number is impressive, but it’s not the story. The story is what this loan reveals about market structure. Southern Company operates in the vertically integrated Southeast, where state regulators directly approve generation investments and utilities earn a regulated rate of return. In this model, the DOE can write a check, the utility can build, and the regulatory pathway is comparatively straightforward.
Contrast this with PJM’s territory. Despite the unprecedented escalation in capacity prices, PJM’s market cannot replicate what Southern is doing. In the RTO model, the federal government cannot direct generation construction. It can only signal, pressure, and propose tariff changes that must survive stakeholder processes and FERC approval.
The entity that controls revenue (PJM’s auction) has no obligation to ensure sufficient capacity exists. The entity that approves construction (state regulators) has no control over whether the market economics justify building. Wood Mackenzie’s 2025 Horizons Report confirms this dynamic directly: “Vertically integrated regulated utilities are proving to be advantaged compared to deregulated markets in getting large loads connected to the grid.” Forward energy prices in PJM and ERCOT, Wood Mackenzie notes, remain “far below what would be required to incentivize construction of new generation facilities,” meaning the price signal in capacity markets, however emphatic, is contradicted by the energy market signal generators actually depend on for day-to-day revenue.
This is probably the most important paragraph in this piece. The Southern loan and the PJM impasse are two expressions of the same deficit running through fundamentally different institutional channels. In one, the supply response is underway. In the other, an 11x price signal is still waiting for a regulatory process to decide whether the market can act. If you understand this divergence, you understand where the returns will concentrate for the rest of the decade.
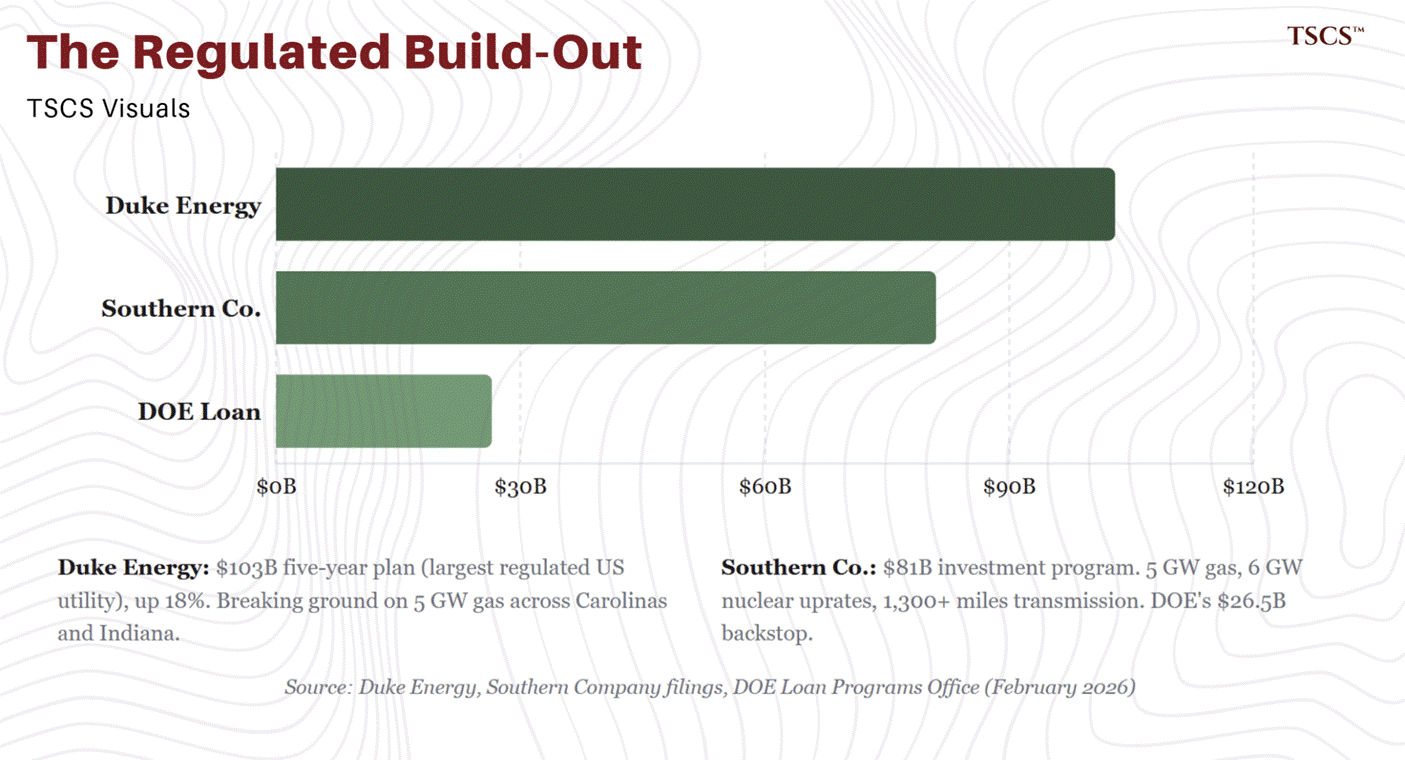
The regulated supply response is broadening. On February 12, 2026, Duke Energy announced a $103 billion five-year capital plan, the largest of any regulated US utility, up 18% from its prior plan. The investment includes 14 GW of new generation capacity and 4.5 GW of battery energy storage, with Duke breaking ground on 5 GW of new natural gas generation across the Carolinas and Indiana. Combined with Southern’s $81 billion investment program and the $26.5 billion DOE loan, the pattern is unmistakable: the regulated Southeast is building. The deregulated markets are debating.
Jeff Currie at Carlyle has framed the broader dynamic as “The New Joule Order”: the post-2010 investment boom made renewables cost-competitive but failed to resolve system bottlenecks, producing malinvestment and grid congestion instead. The deficit is, in part, the bill coming due for a decade of optimising the wrong variable, levelised cost of energy over return on deployed capital.
Wall Street sees $700 billion+ in grid investment needed by 2030
Wall Street has noticed. Goldman Sachs Research estimates approximately $720 billion in US grid spending through 2030, broken down as $444 billion for generation capacity and $302 billion for transmission. Goldman projects US power demand growing at a 2.4 to 2.6% CAGR through 2030, with data centers contributing roughly half of that growth. In a January 2026 Bloomberg report, Goldman analyst Samantha Dart warned that almost all US power grids will lack the typical 15% reserve margin by 2030. Goldman estimates 82 GW of new capacity is needed for data center demand alone, split roughly 60/40 between natural gas and renewables.
Other major estimates from McKinsey, Morgan Stanley, S&P Global, and BloombergNEF range from $500 billion to over $1 trillion depending on scope and methodology. The specific figures differ, but the directional consensus is uniform: hundreds of billions in grid investment are needed this decade, and current run-rates are insufficient.
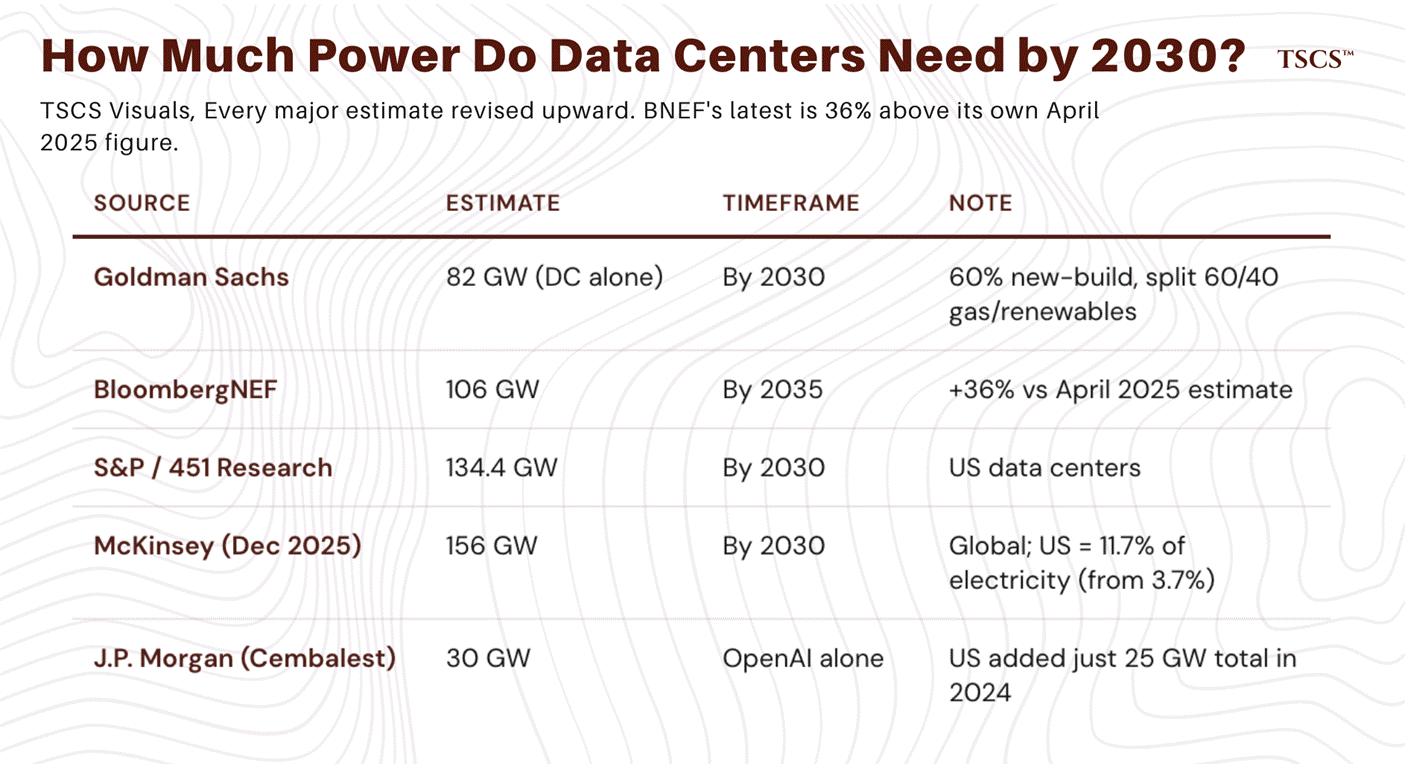
Two estimates deserve specific attention. BloombergNEF’s January 2026 projection of 106 GW in US data center demand by 2035 is 36% above its own estimate from just nine months earlier, making it the clearest single illustration of how rapidly the consensus is shifting. And J.P. Morgan’s Michael Cembalest, in January 2026, offered the most grounding calculation: OpenAI alone would need 30 GW of new generation capacity by 2030.
The entire US added just 25 GW in 2024 after adjusting for intermittency and reliability of new capacity. One company. More new generation than the entire United States added in 2024. At that point, the deficit thesis does not depend on trusting any bank’s headline number. It depends on basic arithmetic.
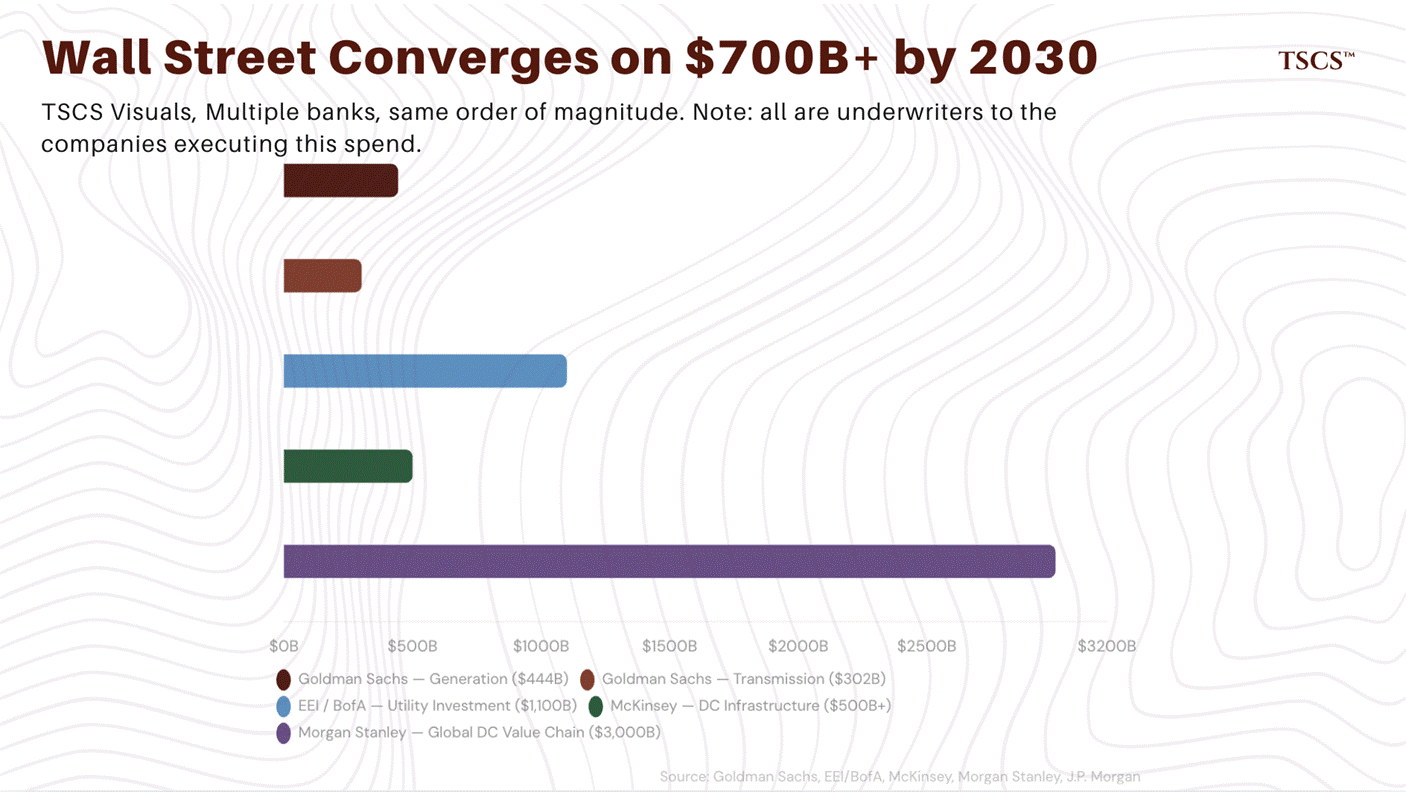
A note on interpreting these estimates. Goldman Sachs, Morgan Stanley, and J.P. Morgan are underwriters, advisors, and lenders to the utilities, independent power producers, and data center operators that would execute this spending. Their estimates of required investment are, functionally, TAM projections for their own deal pipelines. McKinsey consults for many of the hyperscalers driving data center expansion. This does not mean the estimates are wrong, but let’s not pretend they are disinterested analysis either. What makes them credible despite the incentive alignment is their consistency with non-commercial sources: NERC’s 224 GW figure, PJM’s capacity shortfall, and the EIA’s demand forecasts all converge at comparable magnitudes.”
Electricity prices are rising at double the rate of inflation
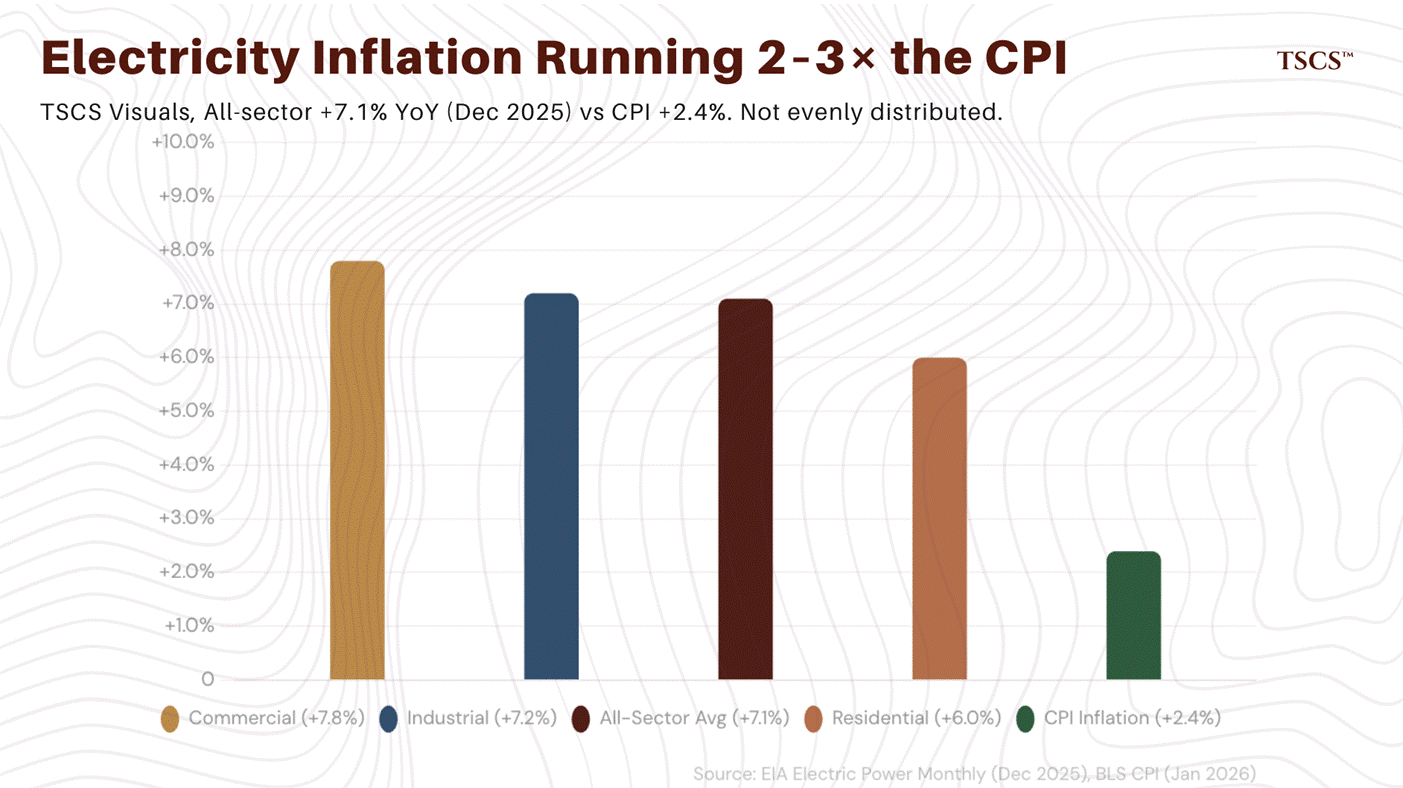
The deficit is already showing up in people’s electricity bills. The EIA’s Electric Power Monthly shows the December 2025 all-sector average was 13.73¢/kWh, up 7.1% year-over-year. The residential sector rose 6.0%, commercial 7.8%, and industrial 7.2%. Choose Energy’s February 2026 report, using the latest EIA data, puts the average US residential rate at 17.78¢/kWh, up 5.5% year-over-year.
Against CPI inflation of 2.4% for the 12 months ending January 2026 (BLS), electricity price increases of 5–7% ran at roughly double the general rate. Key drivers include grid infrastructure upgrades, natural gas prices (up ~56% in 2025 for spot prices), data center demand, and tariffs on imported construction materials.
The cost burden is not evenly distributed.
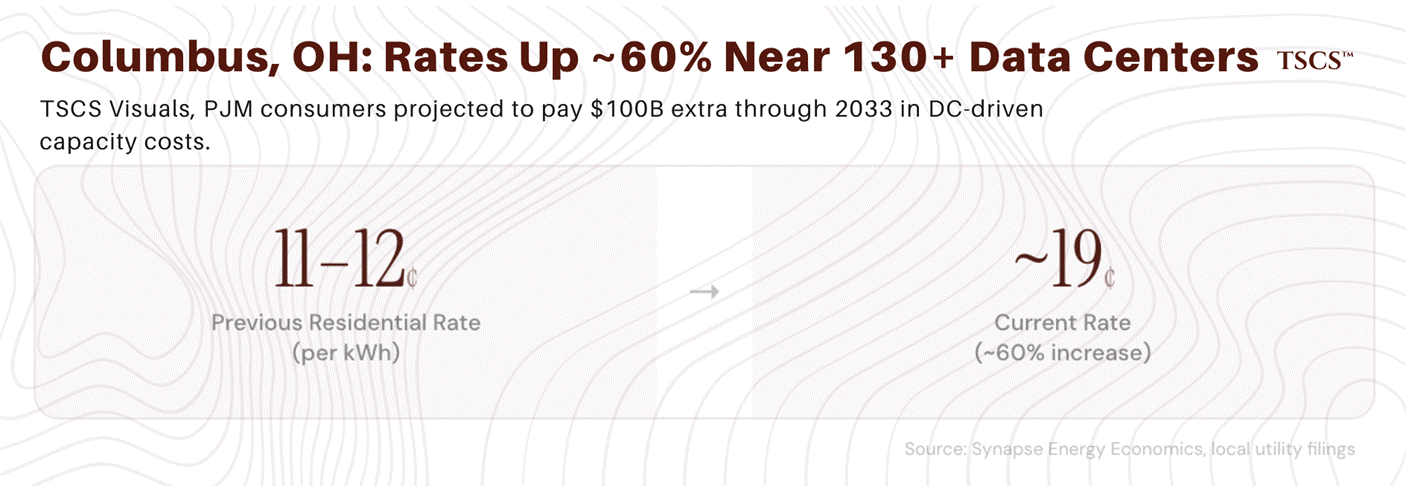
Near Columbus, Ohio, where more than 130 data centers are either operating or planned, residential utility rates have risen roughly 60%, from 11 to 12 cents per kilowatt-hour to approximately 19 cents.
J.P. Morgan’s Michael Cembalest quantified the dynamic in his 2026 “Smothering Heights” outlook: in PJM, 70% of the recent increase in electricity costs was attributable to data center demand, and specialized power rates for most data centers still aren’t high enough to cover the cost of new generation capacity, leaving residential and commercial customers to subsidise the difference.
Synapse Energy Economics projects that PJM consumers will pay an additional $100 billion through 2033 in data center-driven capacity costs. Goldman Sachs forecasts consumer electricity inflation to jump 6% between 2026 and 2027. This raises what I think is the most underappreciated risk in the entire deficit thesis: political sustainability. At some point, a state legislator in Ohio whose constituents have seen their electricity bills rise 60% is going to ask why they are subsidizing Meta’s power consumption. When that question gets loud enough, the answer will not be friendly to merchant generator earnings. Whether the political constraint binds before the physical supply gap closes is genuinely uncertain, and I do not think the market is pricing it.
What breaks the thesis, and how we’ll know
I have spent the past several thousand words making the case that the deficit is real, structural, and accelerating. Now I am going to try to break my own thesis. A thesis that cannot be falsified is not analysis, it is narrative, and I have no interest in writing narrative. What follows are the specific conditions under which I am wrong, and the metrics that will tell us which scenario is unfolding.
The thesis, stated precisely: US electricity demand growth will persistently outrun supply additions through at least 2029, producing rising capacity prices, deteriorating reserve margins, and structurally higher electricity costs. The deficit is concentrated in RTO markets (PJM, ERCOT, MISO) and driven primarily by data center load that is contractually committed rather than speculative.
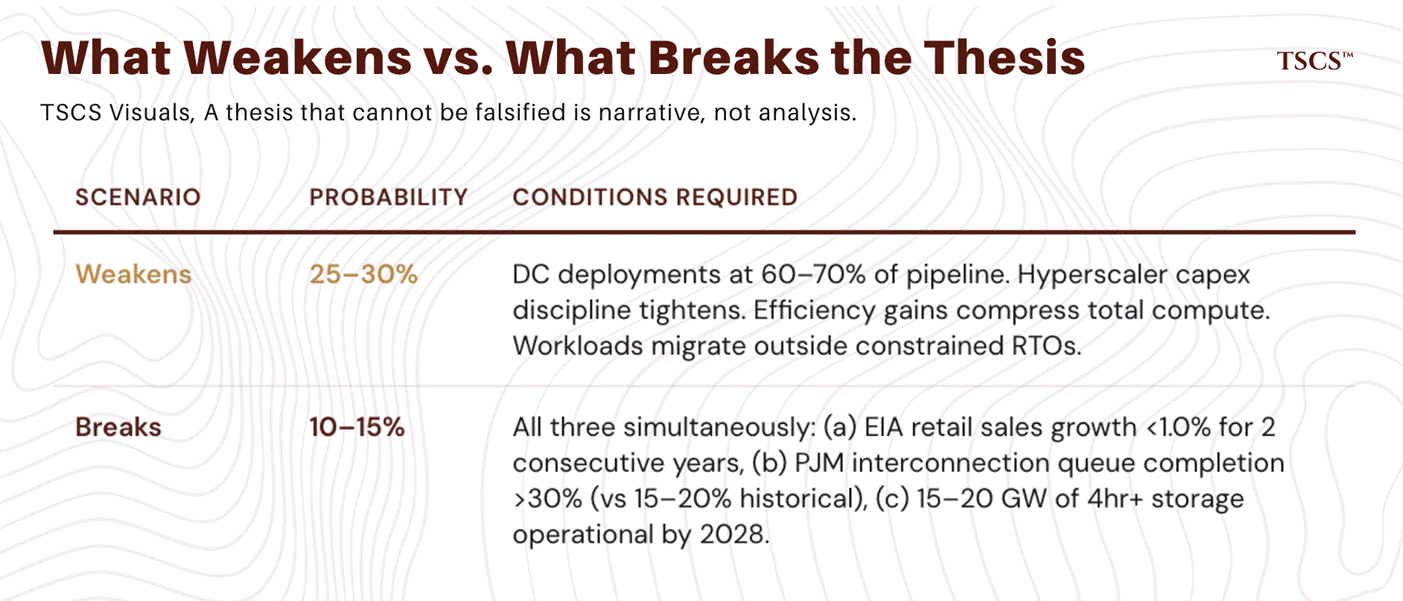
What would weaken the thesis:
The most plausible softening scenario is not a demand collapse but a moderation, where data center deployments proceed at 60–70% of current pipeline projections rather than 80–90%. This could happen if hyperscaler capital discipline tightens (watch Meta, Microsoft, Amazon, and Google capex guidance through 2026–2027 earnings cycles), if inference efficiency gains begin compressing total compute demand rather than merely lowering per-query costs, or if power cost escalation forces workload migration to regions outside the constrained RTOs.
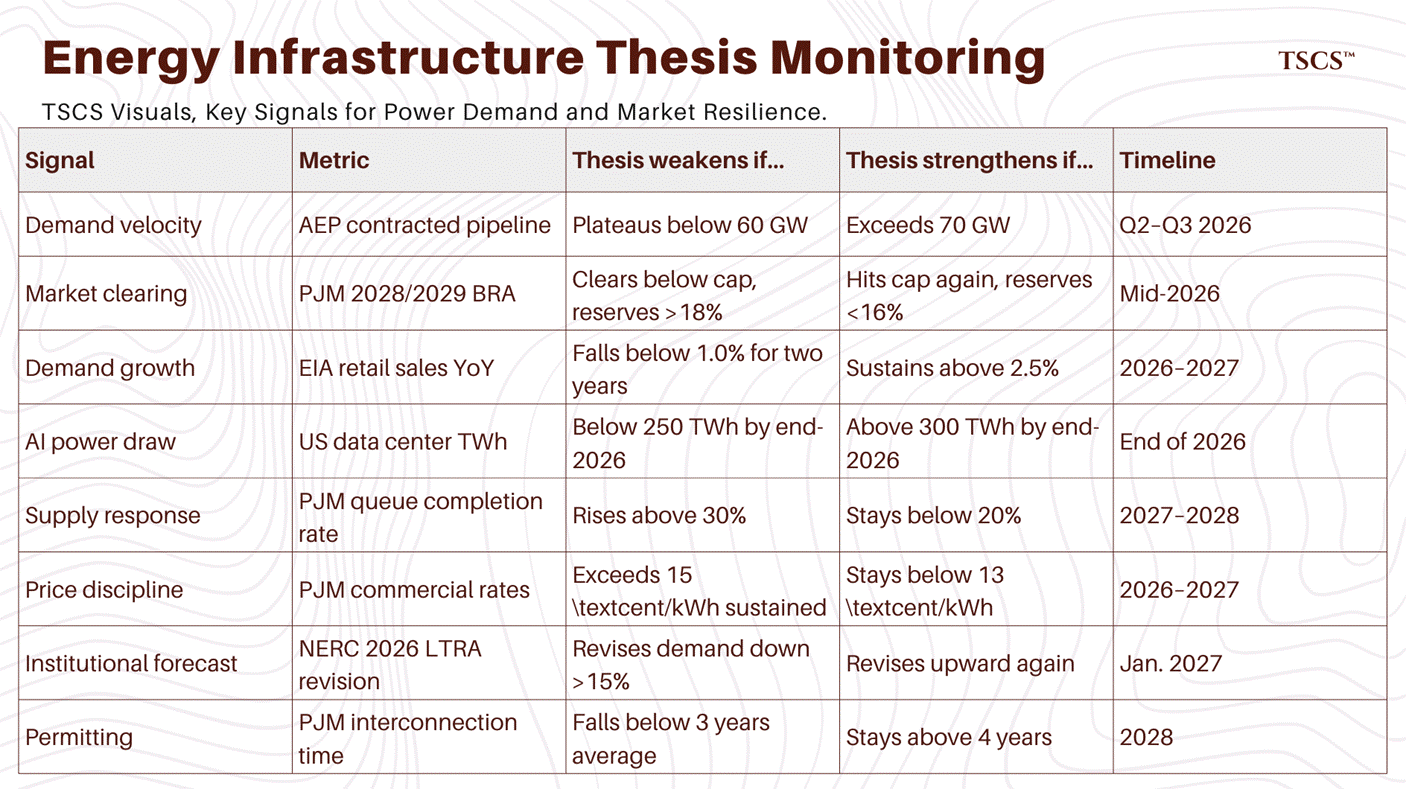
The near-term signal to watch: AEP’s contracted large-load pipeline. It doubled from 28 GW to 56 GW in four months through Q4 2025. If that figure plateaus or declines through the first half of 2026, it suggests hyperscaler commitments are stabilizing rather than accelerating. Conversely, if it crosses 70 GW by Q3 2026, the demand trajectory is steepening beyond even the current consensus.
The structural signal: NERC’s 2026 LTRA, due January 2027. The 2025 edition revised projected summer peak growth upward by 69% in a single year. If the 2026 edition revises downward by more than 15%, the models are finding a ceiling. If it revises upward again, even modestly, the deficit is compounding faster than the institutions tracking it can calibrate.
What would break the thesis:
The deficit thesis breaks under a combination of conditions, not any single one. The scenario requires: (a) a material demand deceleration, with EIA retail electricity sales growth falling below 1.0% for two consecutive years (2026 and 2027), (b) an accelerated supply response, with PJM’s interconnection queue completion rate rising above 30% (versus the historical 15–20%) as permitting reform takes hold, and (c) battery storage deployment exceeding forecasts by enough to offset thermal retirements, roughly 15–20 GW of four-hour-plus storage operational by 2028.
All three would need to occur roughly simultaneously. Any one alone is insufficient, and here is why.
Demand moderation with unchanged supply constraints still produces a deficit. Accelerated supply into unchanged demand growth still leaves a gap, because the supply pipeline starts from such a deep hole. And battery storage, while critical for peak shaving, cannot yet substitute for the multi-day reliability that thermal generation provides during extended weather events, a limitation Winter Storm Fern made visceral.

The single most important data point in the next 12 months: PJM’s 2028/2029 Base Residual Auction, expected in mid-2026. The last three auctions told a story of escalating crisis: clearing prices rose from $28.92 to $269.92 to $329.17 (capped) to $333.44 (capped), and the most recent auction failed to meet the reliability requirement for the first time in market history. If the 2028/2029 auction clears below the price cap with reserves above 18%, the market is self-correcting. If it hits the cap again with reserves below 16%, the structural shortage is entrenching. There is no ambiguity in this metric; it is the single cleanest measure of whether the deficit is widening or narrowing in the region that matters most.
What the demand skeptics get right, and where they overreach:
Demand forecasting has a poor track record during technology transitions. Cryptocurrency mining was projected to consume 3 to 5% of US electricity by the mid-2020s; actual consumption peaked well below those estimates as mining migrated offshore and efficiency improved. More recently, PJM itself has signalled that its upcoming load forecast may be materially lower than prior projections, reflecting stricter vetting of speculative large loads and a reduced economic outlook. The EIA similarly revised down its 2026 generation growth forecast.
NERC’s own projections increased 69% in a single year, which could indicate that conditions are deteriorating faster than expected, or that the models are unreliable in periods of rapid change and may overshoot in either direction.
The 224 GW figure should be treated as directionally significant rather than precisely predictive. Let me put my own numbers on the table: I assign roughly 55 to 65% probability to a base case where summer peak demand growth lands between 150 and 200 GW over the decade, with the 224 GW headline representing the upper bound rather than the central estimate. Even the low end of my range, 150 GW, would require roughly triple the pace of firm generation additions the US has managed in any recent decade. So the question I am actually trying to answer is not ‘is the deficit real?’ It is: ‘is this a five-year crisis or a ten-year structural shift?’ The monitoring framework below is how we will find out.
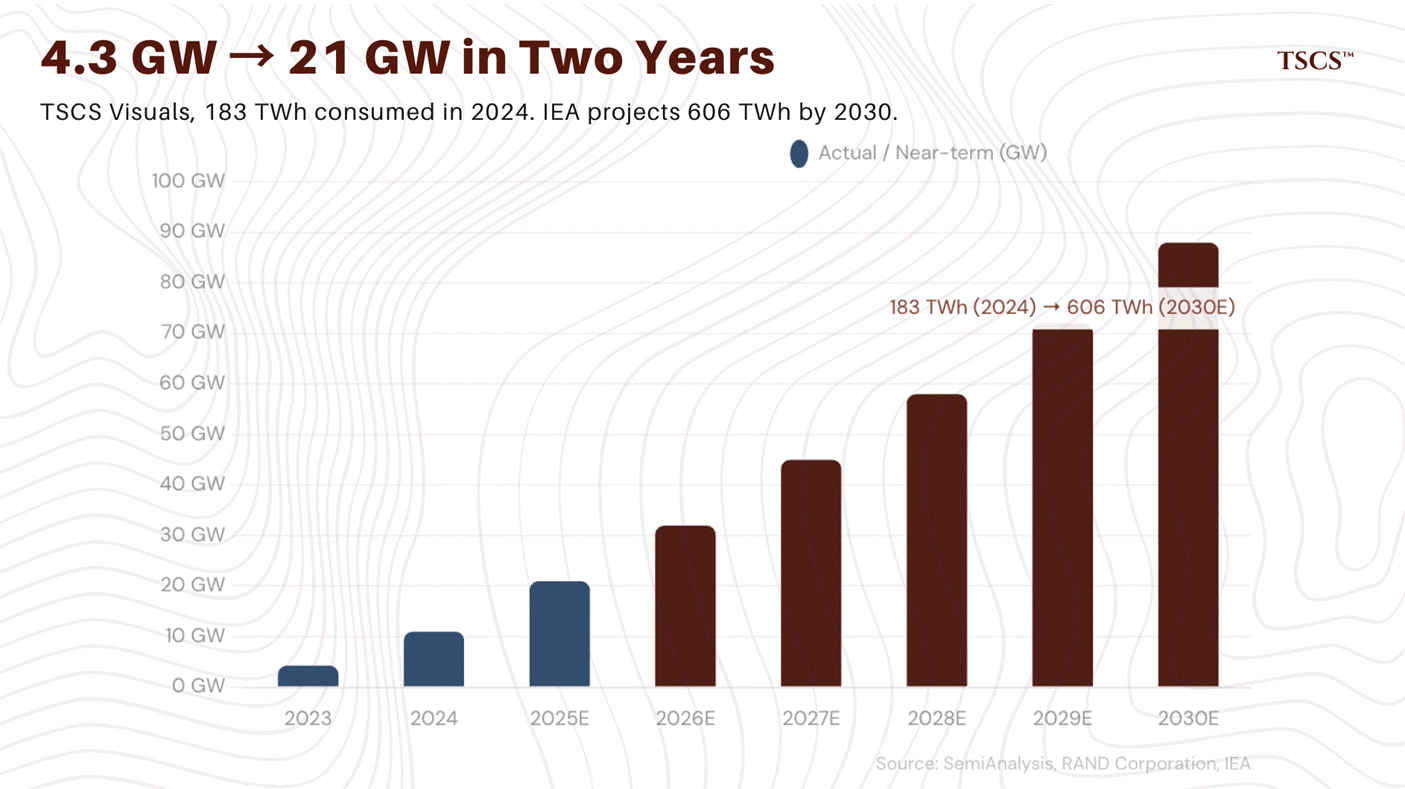
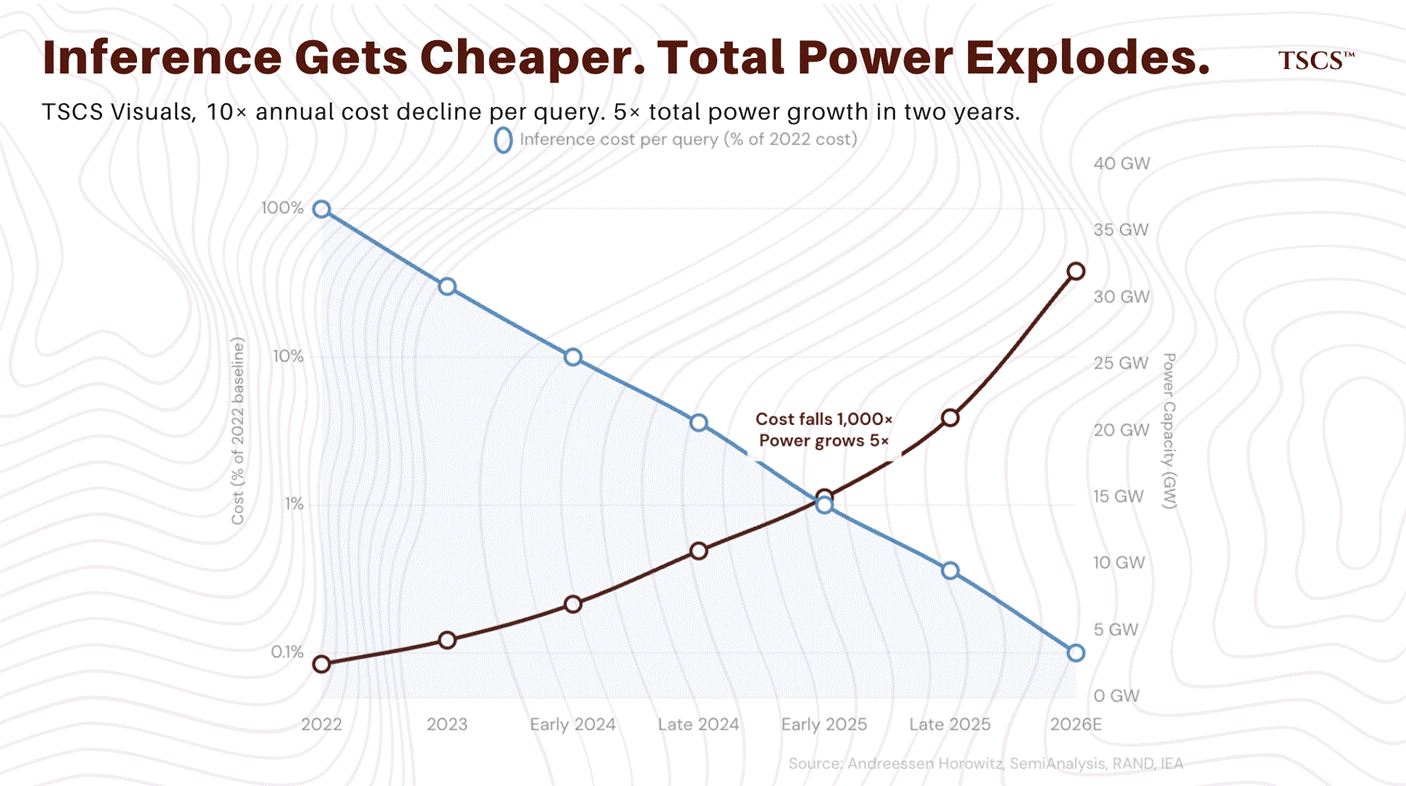
AI inference efficiency is improving at a pace that has no precedent in computing history. Andreessen Horowitz’s “LLMflation” analysis documents a 10x annual decline in the cost of equivalent-quality inference, while Stanford HAI’s 2025 AI Index found that the cost of achieving GPT-3.5-level performance fell 280-fold in just 18 months. If this trajectory continued in isolation, it would meaningfully moderate AI’s power requirements.
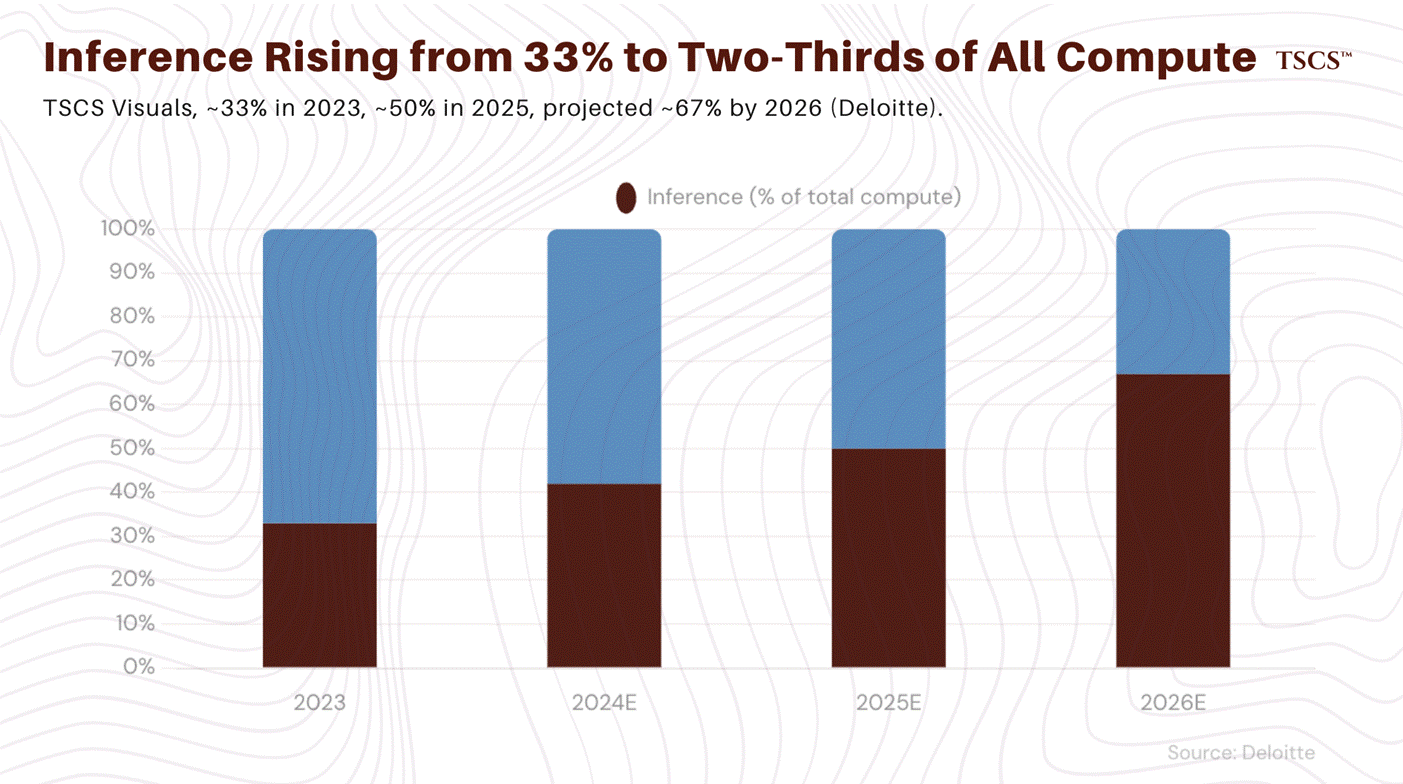
It has not moderated them. AI data center power capacity grew from approximately 4.3 GW in 2023 to roughly 11 GW in 2024 and an estimated 21 GW in 2025, a near-fivefold increase in two years. Inference now accounts for 80 to 90% of all AI computing. The mechanism is more potent than simple Jevons dynamics, though it operates through related logic. As inference costs fall, three things happen simultaneously: the addressable market for AI applications expands because previously uneconomic use cases become viable; models grow larger and more reasoning-intensive, partially offsetting per-unit efficiency gains with greater per-query complexity; and AI gets embedded into products used by billions of people daily, multiplying total query volume by orders of magnitude. The net effect is that total AI power consumption has grown nearly fivefold in two years despite dramatic efficiency improvements at the component level. This is the rebound effect operating at industrial scale, and it is the strongest argument against the efficiency bears.
The genuinely uncertain question is not whether these rebound dynamics are present (they obviously are) but whether they persist indefinitely.
At some point, physical constraints, power availability, chip supply, cost, impose a ceiling on total inference volume that no amount of efficiency improvement can circumvent. We are not there yet. But dismissing the possibility is as intellectually lazy as dismissing the deficit itself. The metric to watch: total US data center power consumption as reported by the IEA and EIA. If the 2024 figure of approximately 183 TWh fails to reach 250 TWh by end of 2026, the efficiency bears have a stronger case than the pipeline data suggests. If it exceeds 300 TWh, Jevons dynamics are dominating and the deficit is widening faster than the base case assumes.
Price signals create demand discipline, eventually. This piece documents electricity price increases of 5–7% against 2.4% general inflation. At some threshold, rising power costs will slow data center deployment, push workloads to regions with cheaper power, or accelerate on-site generation. The tripwire is PJM capacity costs flowing through to commercial rates. If average commercial rates in PJM territory exceed 15¢/kWh on a sustained basis (they averaged roughly 12–13¢ in 2025), expect political intervention to accelerate, cost allocation fights to intensify, and some marginal data center projects to defer or relocate. The deficit thesis implicitly assumes demand is relatively inelastic at current price levels, which may hold through 2027 but becomes less certain if capacity prices continue escalating at the rates PJM auctions suggest.
The supply response could arrive faster than assumed. Doomberg has argued, compellingly, that “shortages of products with inelastic demand profiles inevitably prompt robust market responses,” and that the gas turbine scarcity will resolve on a timeline few anticipate. The question is whether that response arrives within the window the grid can survive. Turbine lead times of five to seven years and interconnection queues of four-plus years create a minimum lag that no amount of capital can compress below three to four years. The deficit thesis does not require the shortage to be permanent. It requires it to outlast the grid’s tolerance, which is measured in seasons, not decades.
Interconnection and permitting reform could accelerate supply.
If federal permitting reform gains traction (several bipartisan proposals are active), the 400+ delayed transmission projects NERC identifies could move faster than current timelines suggest. The concrete benchmark: if average interconnection time in PJM falls below three years by 2028 (from 4+ today), supply is unlocking faster than the thesis assumes.
To state the probabilities directly: I assign roughly 70 to 75% probability to the base case, the deficit persists through at least 2029, producing structurally higher electricity costs and capacity prices in RTO markets. The remaining probability splits roughly 15 to 20% to a moderation scenario (demand at 60 to 70% of pipeline, supply response faster than expected, deficit closes by 2028) and 5 to 10% to a thesis-breaking combination of demand collapse, accelerated supply, and battery storage at scale. The directional bet is high-conviction. The position sizing is where the uncertainty matters.
The monitoring framework, summarized:
I want to be clear: none of these factors invalidate the core thesis today. The direction of the supply-demand gap is well-supported by every institutional source, market signal, and operational data point available. But the magnitude and duration of the deficit carry meaningful uncertainty, and the difference between a five-year deficit and a ten-year deficit is the difference between a cyclical trade and a generational capital deployment cycle. The framework above is how we will distinguish between those outcomes in real time, rather than in retrospect.
What the deficit means for capital allocation
So the deficit is real, supply cannot respond, and Washington is arguing about whose fault it is. None of that matters to your portfolio unless you know which companies actually benefit and, critically, which ones the market has already figured out. What follows is my framework for how the deficit maps onto specific investment opportunities: who benefits, who is overpriced, and where the market has mispriced the duration of the cycle.
This section is analytical, not advisory. Position sizing, entry timing, and risk tolerance are yours.
The clearest beneficiaries: regulated utilities with load growth
The single most important variable for regulated utility earnings is rate base growth, because regulators allow utilities to earn a return on deployed capital. In an environment where capital deployment is accelerating at the fastest pace in decades, the earnings arithmetic is straightforward: more capital deployed at allowed returns equals higher earnings, with costs recovered through rates over time.
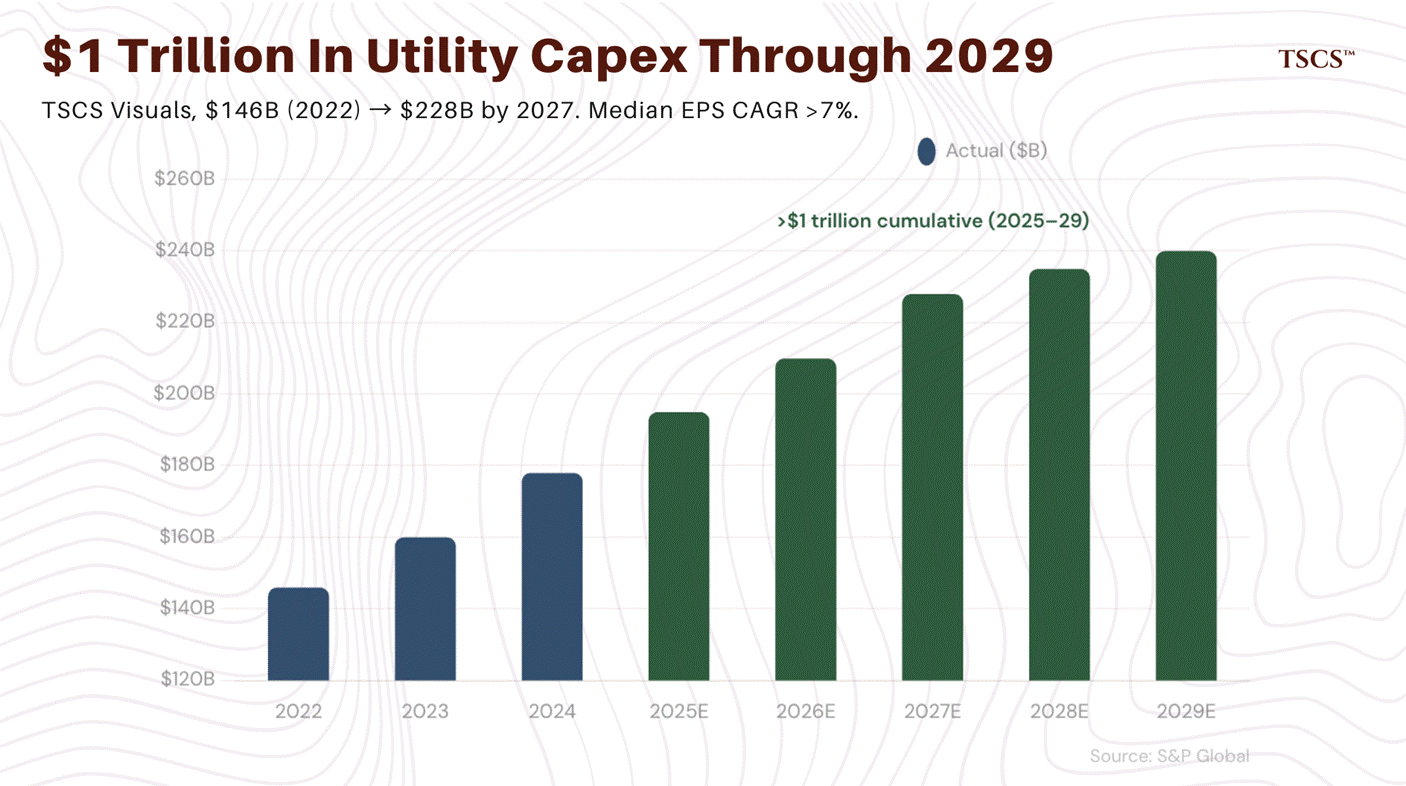
The numbers are already visible. S&P Global projects aggregate US energy utility capital expenditures will exceed $1 trillion from 2025 through 2029, with annual spending reaching $228 billion by 2027, a nearly 50% increase from 2022’s $146 billion. Consensus estimates project a median sector EPS compound annual growth rate above 7% from 2024 to 2027, which would represent the strongest sustained earnings growth the utility sector has delivered in decades. Several companies are guiding materially above this median: AEP raised its long-term EPS growth target to 7 to 9% on a $54 billion capital plan, Duke Energy’s $103 billion program targets 14 GW of new generation, Sempra’s $65 billion plan targets 11% rate base CAGR through 2030, and Southern Company's $81 billion investment program.
The structural advantage of regulated utilities in this environment extends beyond earnings growth. Rising demand allows fixed infrastructure costs to be spread across a larger customer base, which mitigates the affordability concerns that represent the primary political risk to the investment thesis. A 1 GW data center, as Xcel Energy has noted, is roughly equivalent to 1 million residential customers in revenue terms but requires a fraction of the distribution infrastructure. Utilities that are adding large-load customers are simultaneously growing their rate base and improving their cost recovery profile, a dynamic that is new and not yet fully reflected in how the market prices these businesses.
And yet. The sector trades at 17.2x 2026 forward earnings per Gabelli’s analysis, roughly in line with the 25-year median of 16.8x. The market is applying a historically average multiple to what I believe is a significantly above-average growth trajectory. Either the market does not believe the growth will materialize, or the re-rating simply has not happened yet. I think it is the latter, and I think regulated utilities are the most compelling risk-adjusted opportunity in the entire grid deficit value chain.
The risks are execution and regulation. Utilities must raise capital, secure permits, build infrastructure, and obtain regulatory approval for cost recovery simultaneously. The track record on execution for large-scale generation projects, particularly nuclear, is poor. And if demand projections prove overstated, ratepayers could be left funding excess capacity, a dynamic the Southeast experienced in the 2010s.I am not blind to this risk. The deficit thesis must be weighed against the historical pattern of utility overbuilding during demand euphoria. The Southeast has done this before.
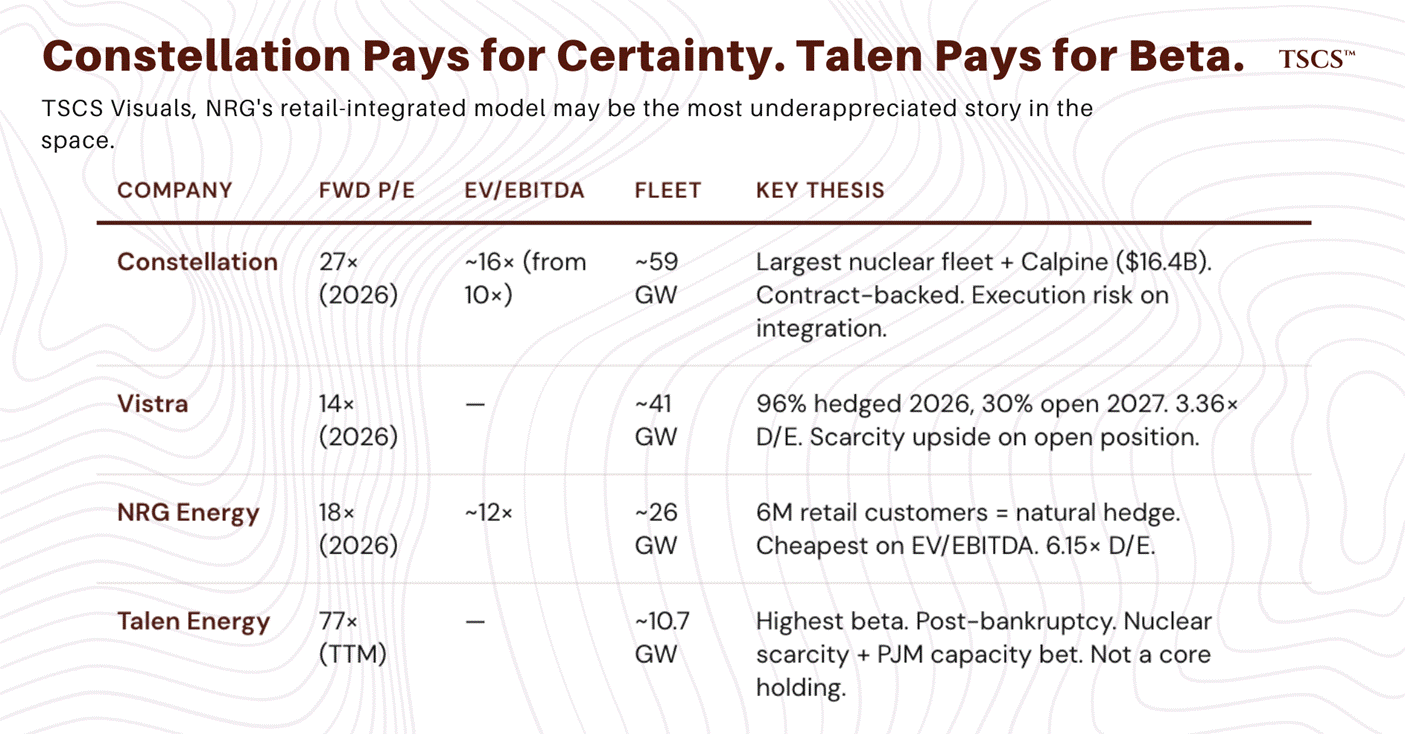
Merchant power producers: the scarcity premium is real, but how much is left?
The independent power producers, Constellation Energy, Vistra, NRG Energy, and Talen Energy, are leveraged to the supply-demand imbalance in a fundamentally different way than regulated utilities. Where regulated utilities earn a return on capital deployed, merchant generators earn market-clearing prices for electricity and capacity. In a deficit environment, those prices rise, and existing generation assets that are already built, permitted, and interconnected become dramatically more valuable because new supply cannot enter fast enough to compete them away.
The market has already moved aggressively on this thesis, with merchant power producers averaging gains of 59% in 2024 and 71% in 2025. But the underlying supply-demand dynamics have, if anything, intensified: PJM's shortfall has worsened, the NERC outlook has deteriorated, and no material new supply has entered the market.
The question I keep coming back to is no longer “is the thesis right?” It is: “what am I paying for it?”
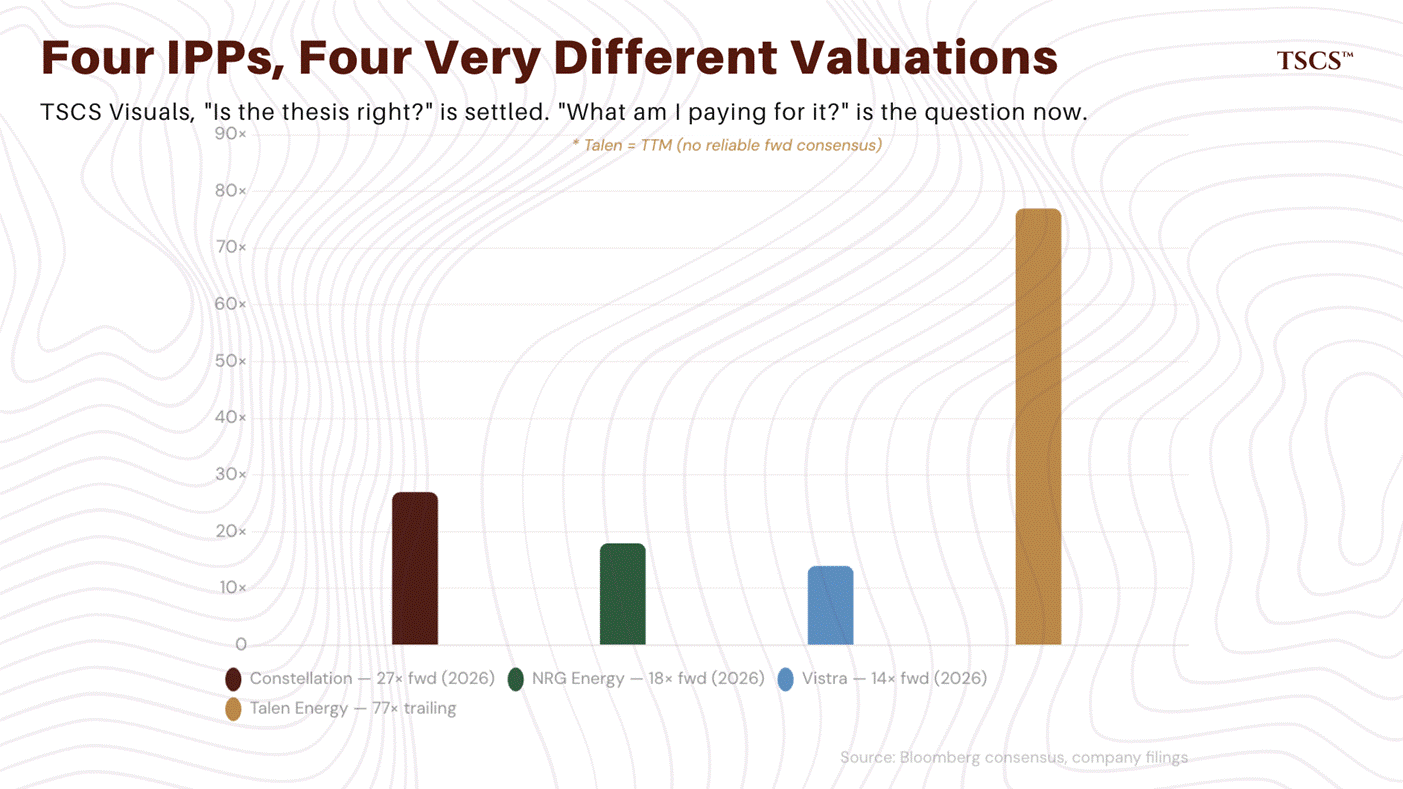
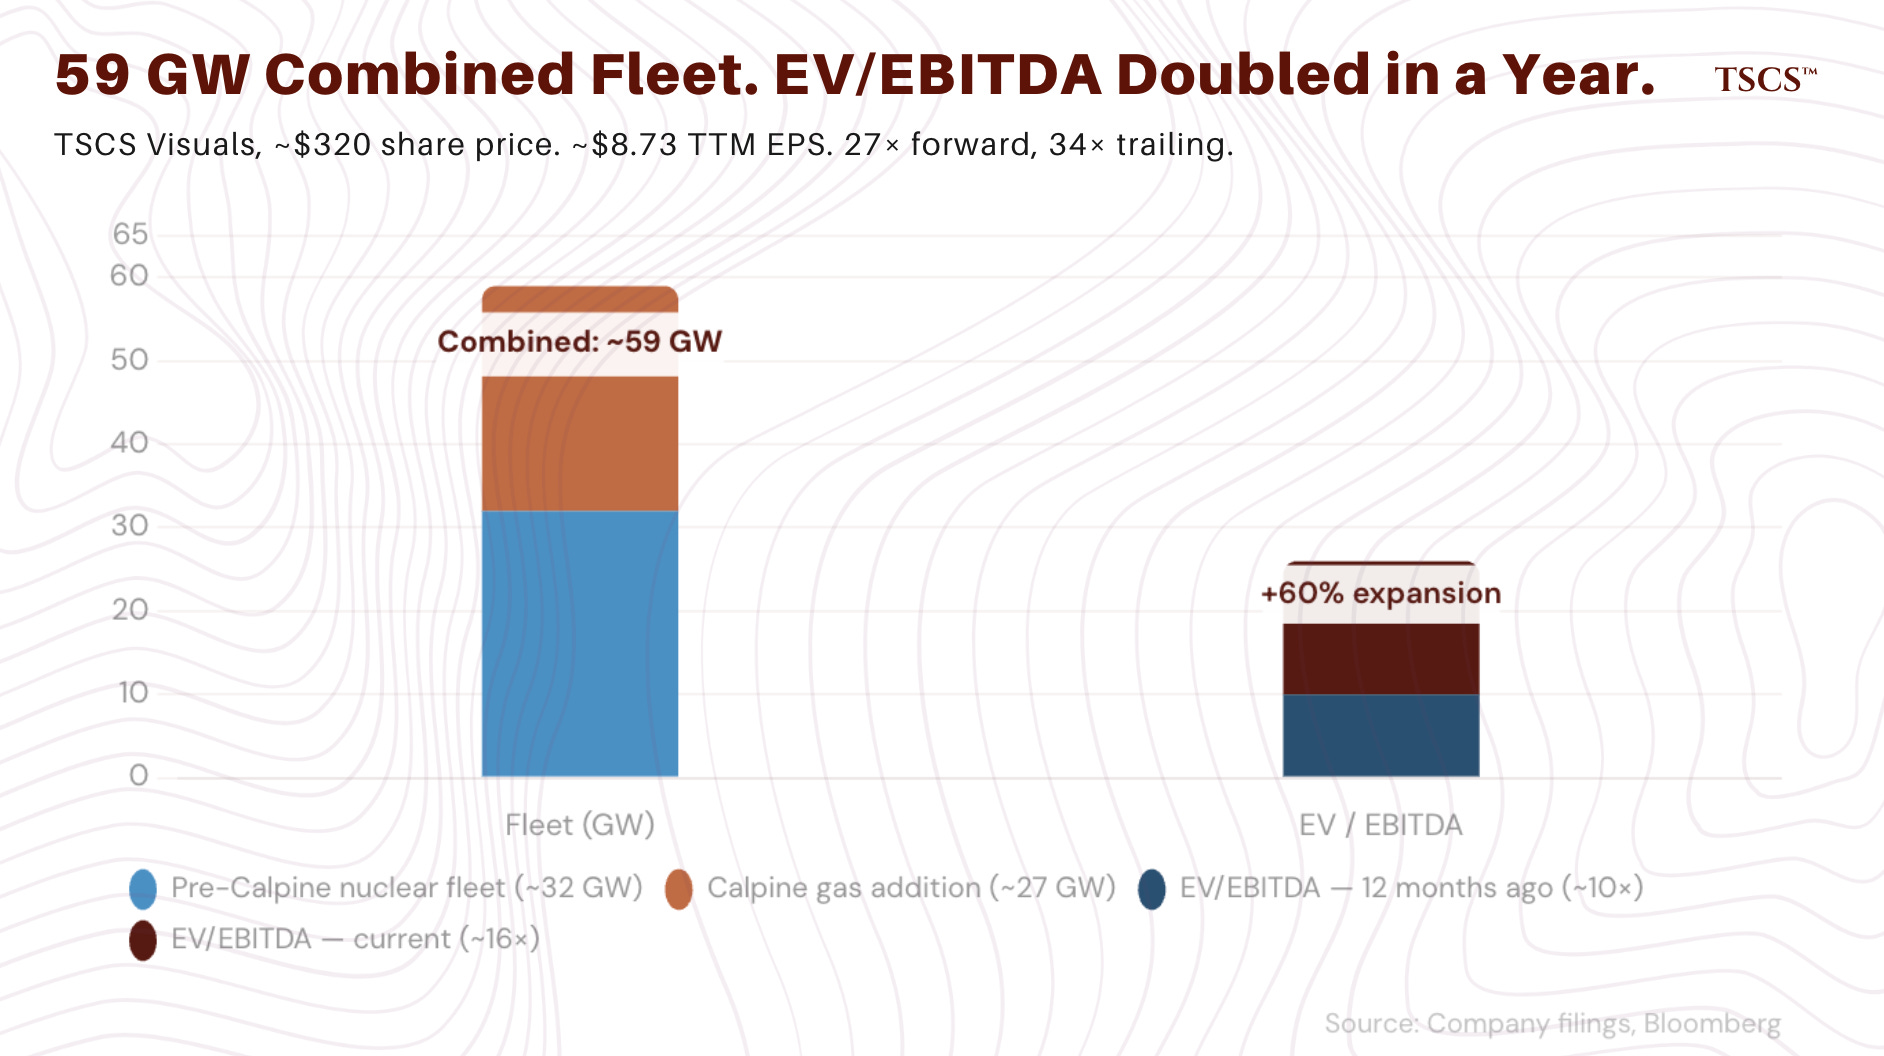
Constellation Energy trades at roughly 27x 2026 forward earnings and 23x 2027 estimates, with a trailing P/E around 34x on TTM EPS of approximately $8.73 and a current share price near $320. The company operates about 32 GW of generation, including the largest US nuclear fleet. The Calpine acquisition, closed in early 2026 for $16.4 billion, adds roughly 27 GW of primarily gas-fired generation, creating a combined fleet exceeding 59 GW. The strategic logic is sound: nuclear provides 24/7 carbon-free baseload power, which is precisely what data centers with net-zero commitments require. The Microsoft PPA underpinning the Three Mile Island Unit 1 restart validated nuclear’s premium in this market. But investors are paying a significant premium for this positioning. At 27x forward earnings, the stock prices in substantial deficit persistence and continued PPA wins. The EV/EBITDA has expanded from roughly 10x to nearly 16x in under a year. The question is whether the Calpine integration delivers the operational synergies needed to justify the multiple, or whether execution risk on a $16 billion deal compresses returns from here.
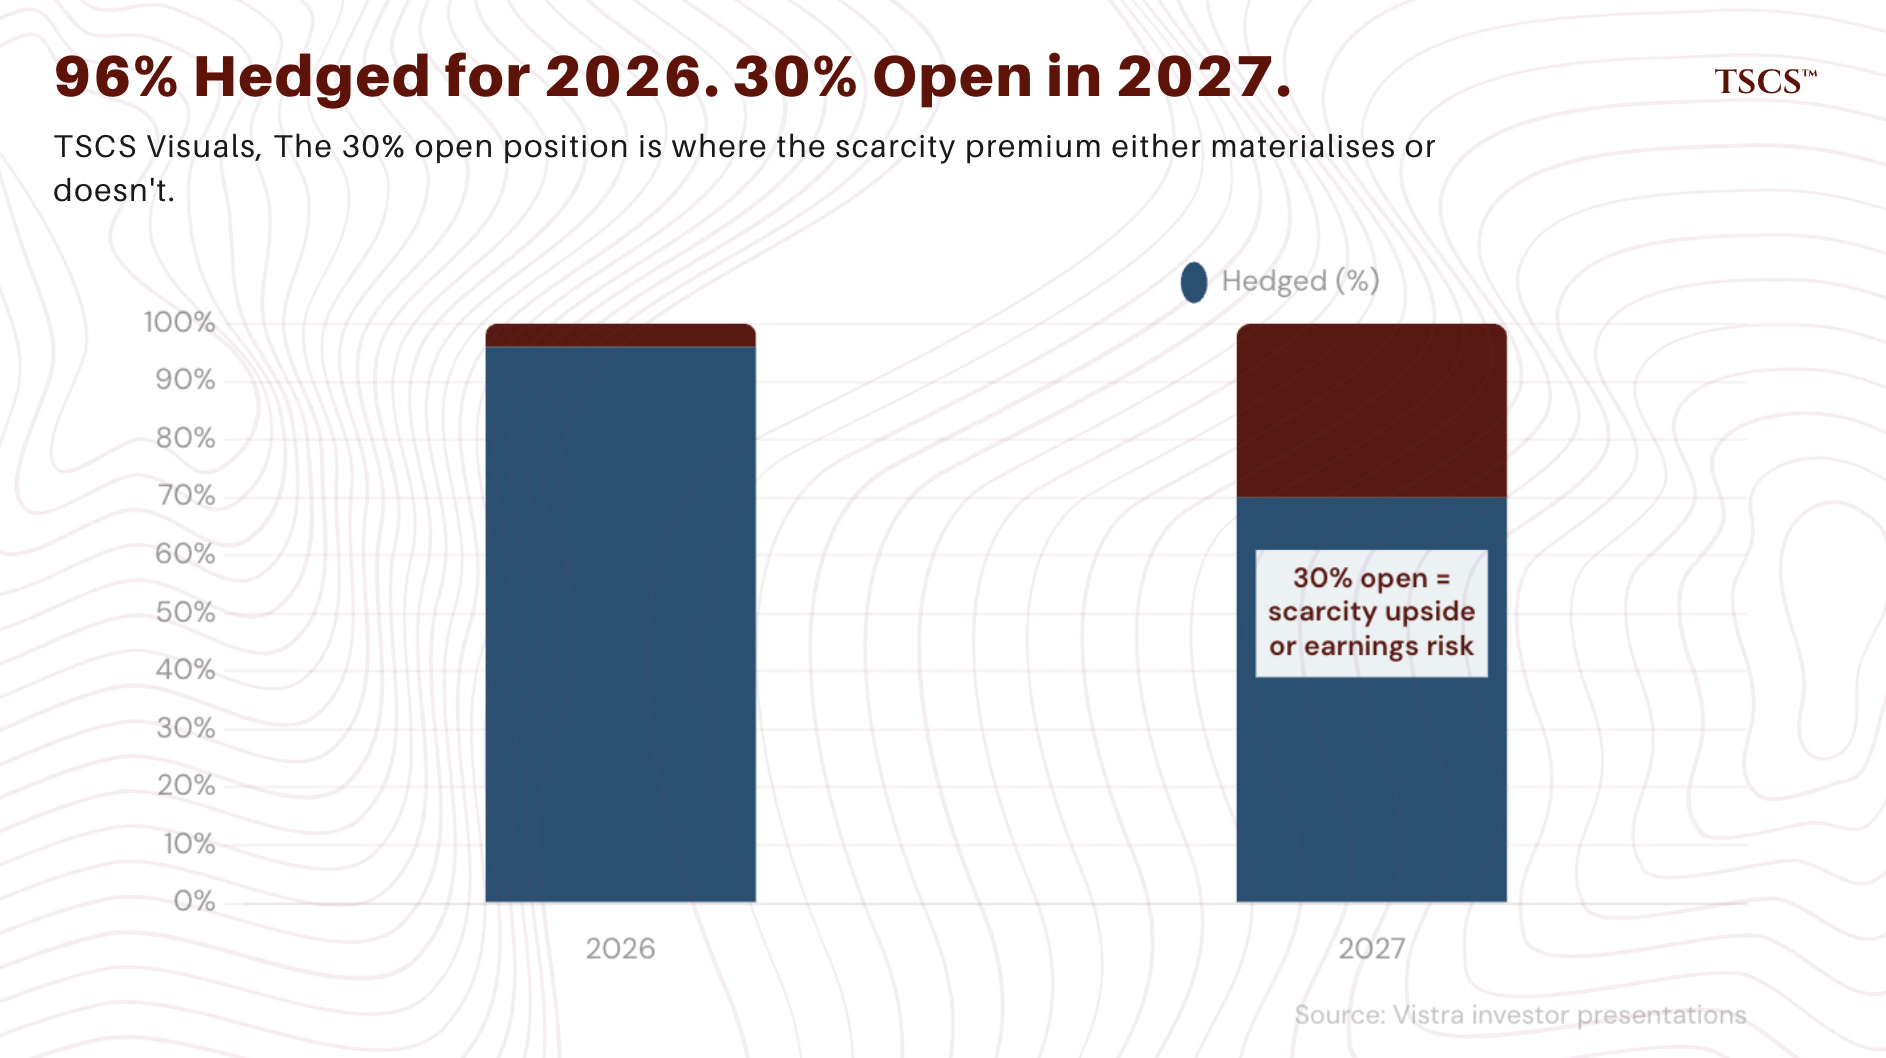
Vistra presents a more nuanced picture. The stock trades at roughly 14x 2026 forward earnings (based on consensus projections for a substantial EPS ramp), with a trailing P/E around 52x reflecting the lag between share price appreciation and earnings delivery. Vistra’s 2025 was defined by Luminant’s nuclear fleet expansion (acquiring the remaining minority stake in Vistra Vision) and aggressive share buybacks, with the company targeting at least $1 billion in additional repurchases through 2027. The hedge book is 96% covered for 2026 and 70% for 2027, providing revenue visibility, but the 30% open position in 2027 is where the scarcity premium either materializes or doesn’t. If wholesale power prices in PJM and ERCOT continue rising, that open exposure is extremely valuable. If capacity additions surprise to the upside or demand moderates, Vistra’s earnings trajectory is more vulnerable than Constellation’s contract-backed model. The 3.36x debt-to-equity ratio also warrants attention; the balance sheet has limited margin for operational missteps.
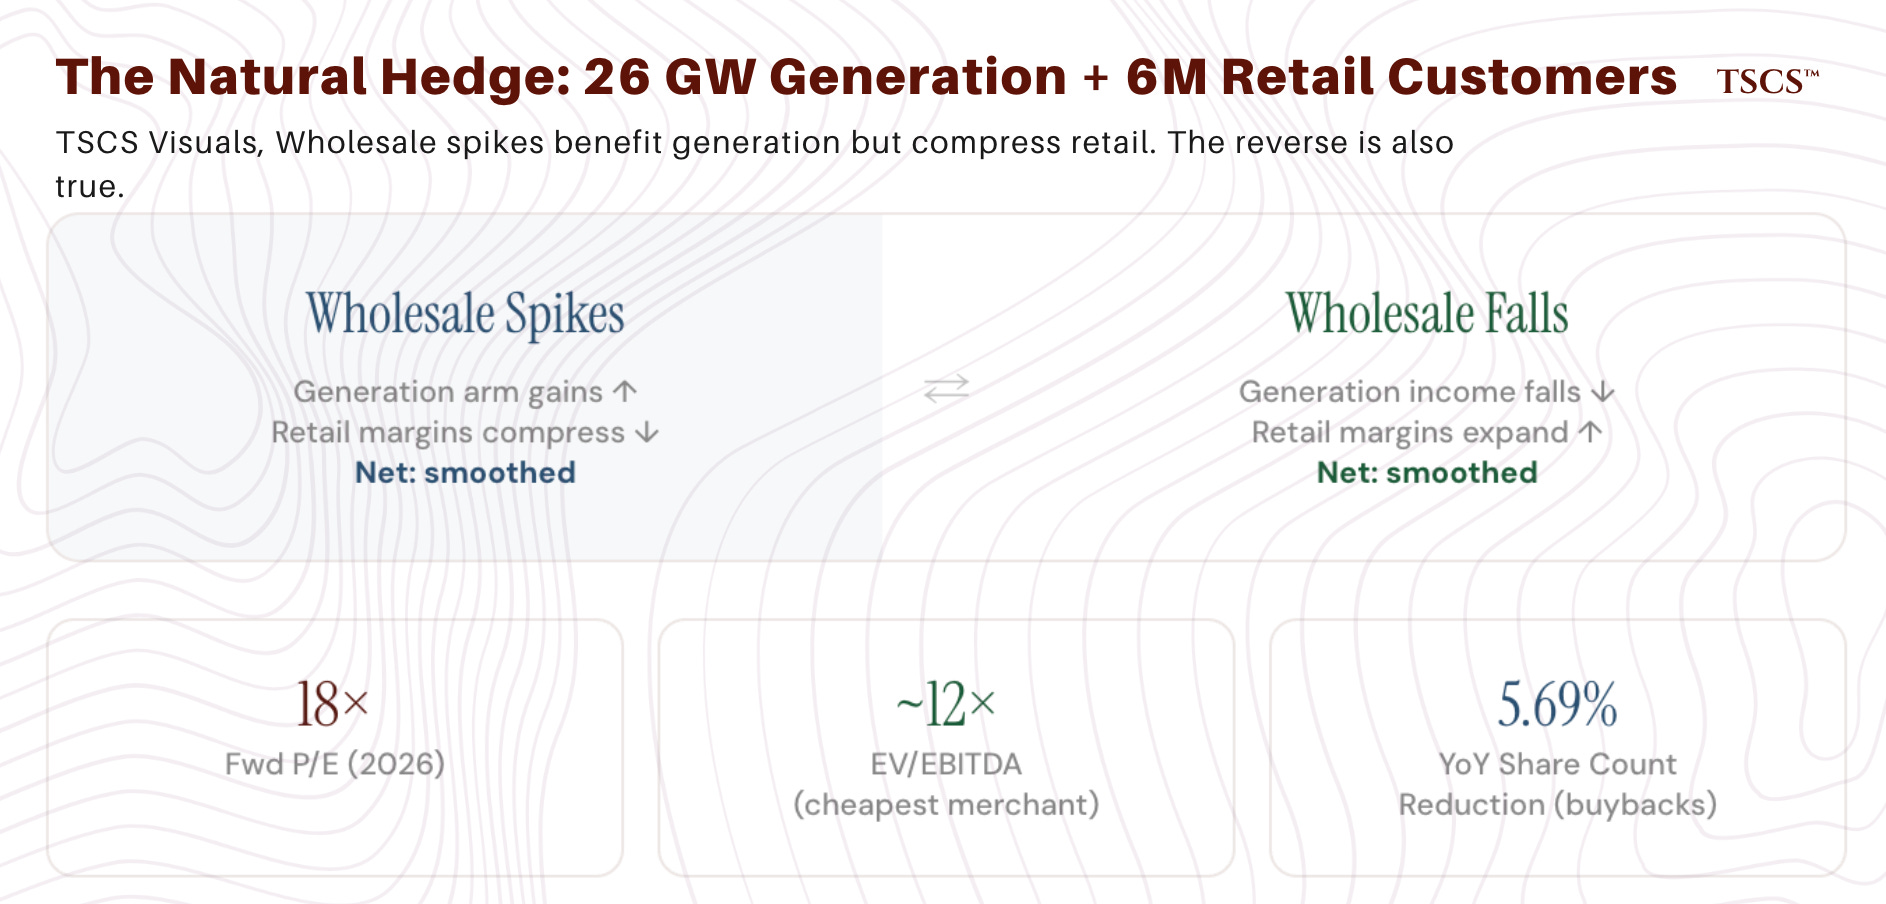
NRG Energy is the most interesting structural story in the merchant space right now, and possibly the most underappreciated. At roughly 18x 2026 forward earnings with an EV/EBITDA of approximately 12x, NRG trades at a meaningful discount to Constellation and Vistra despite completing the $12 billion LS Power acquisition in January 2026, which doubled its generation fleet to roughly 26 GW of predominantly gas-fired capacity. The market’s skepticism appears to center on three things: the high debt load (6.15x debt-to-equity, $12 billion in gross debt), the Vivint Smart Home integration (acquired 2023, still digesting), and questions about whether a retail-integrated model deserves the same scarcity multiple as a pure-play generator.
The contrarian case for NRG hinges on precisely that integration. NRG’s 6 million retail customers provide a natural hedge against wholesale price volatility that pure merchant generators lack. When wholesale prices spike, NRG’s generation arm benefits but its retail arm’s margins compress; the reverse is also true. This creates an embedded smoothing mechanism that should, in theory, warrant a lower cost of capital and more stable earnings profile than Vistra or Talen. The LS Power assets are predominantly located in PJM and the Eastern US, exactly where the deficit is most acute. If the market begins to credit NRG’s integrated model with the stability premium it arguably deserves, the re-rating potential is significant. The 5.69% year-over-year reduction in share count through buybacks indicates management agrees.
Talen Energy is the highest-beta play on the deficit, trading at roughly 77x trailing earnings with a market cap that has expanded dramatically since its 2023 bankruptcy emergence. The company operates approximately 10.7 GW, including the Susquehanna nuclear station, which was at the center of the Amazon hyperscaler PPA that initially validated nuclear-for-data-center deals before regulatory complications emerged. Talen is essentially a leveraged bet on nuclear scarcity value and PJM capacity prices. If the deficit persists and nuclear earns premium pricing, Talen’s per-MW valuation could continue expanding. If capacity additions accelerate or regulatory intervention compresses prices, the downside is severe given the valuation starting point. This is a position for allocators with high conviction and appropriate risk tolerance, not a core holding.
Now for the risk that I think most merchant generator bulls are underweighting: political intervention.
PJM’s price cap has already suppressed auction clearing prices by an estimated $10 billion in a single delivery year, and the cap has been extended through 2029/2030 with bipartisan support.
If the political cost of rising electricity bills becomes untenable, further regulatory action to protect ratepayers could directly impair merchant generator economics. The scarcity premium is real. But it exists at the pleasure of regulators who retain the authority to compress it, and who face re-election campaigns funded by voters who pay electricity bills.
Grid equipment and infrastructure: the tightest supply chain in a generation
Every megawatt of new generation requires transformers, switchgear, circuit breakers, transmission cable, and gas turbines. Every mile of new transmission requires steel, conductors, and substations. The supply chain for this equipment is the tightest it has been in the modern era, and the companies that manufacture it are reporting order backlogs that stretch years into the future.
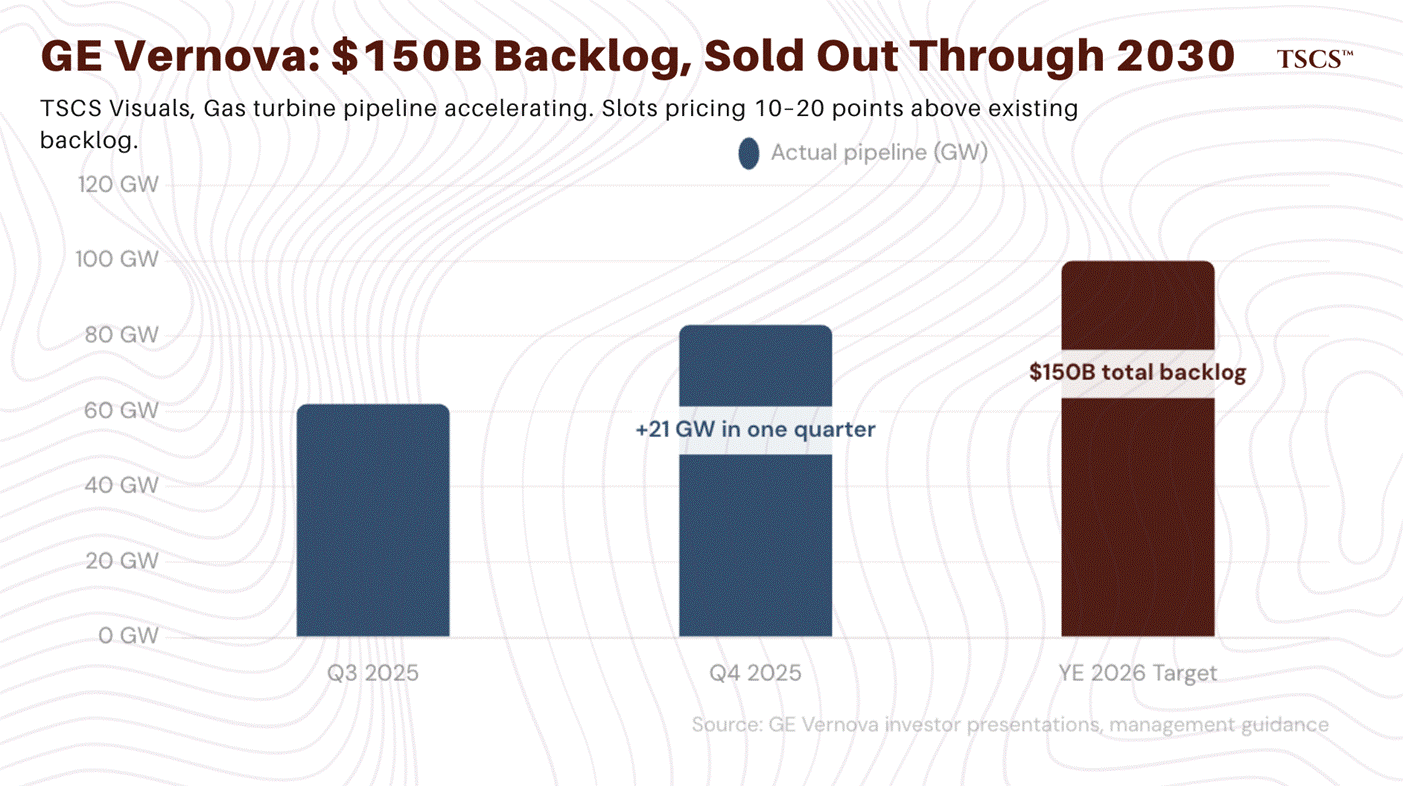
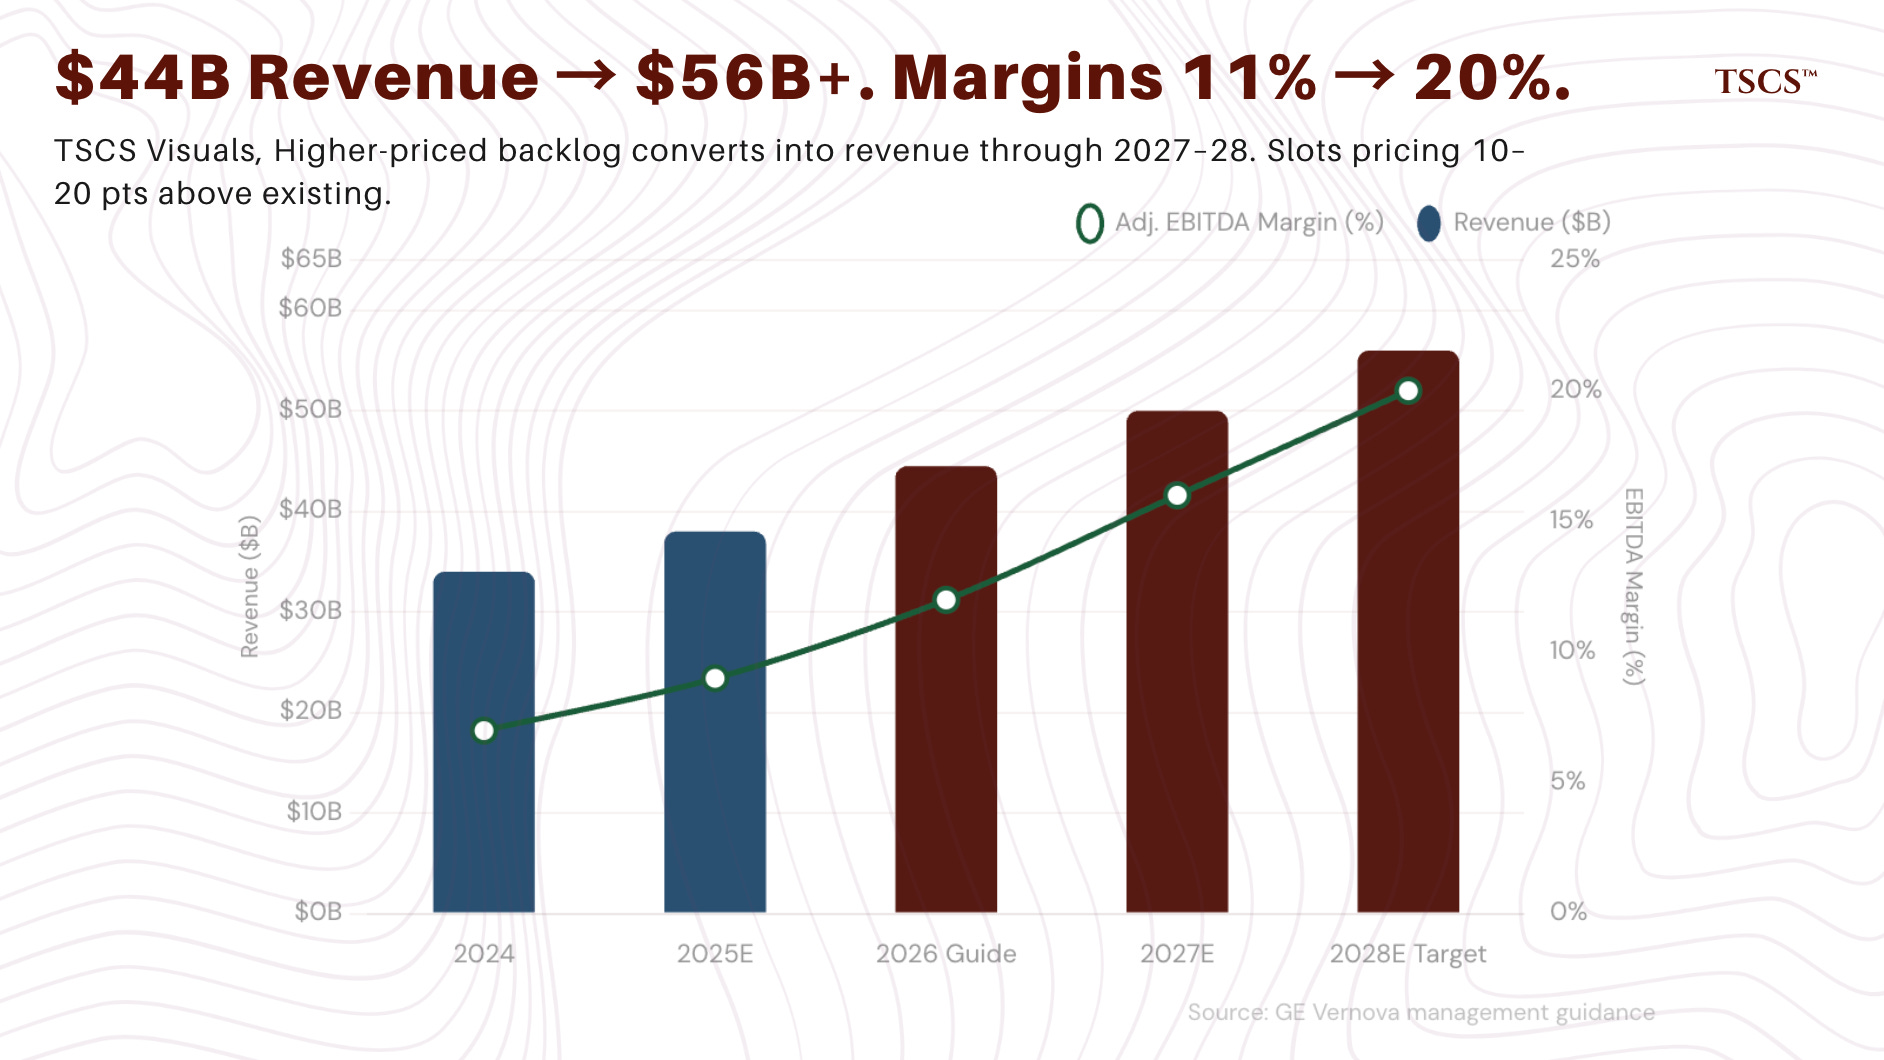
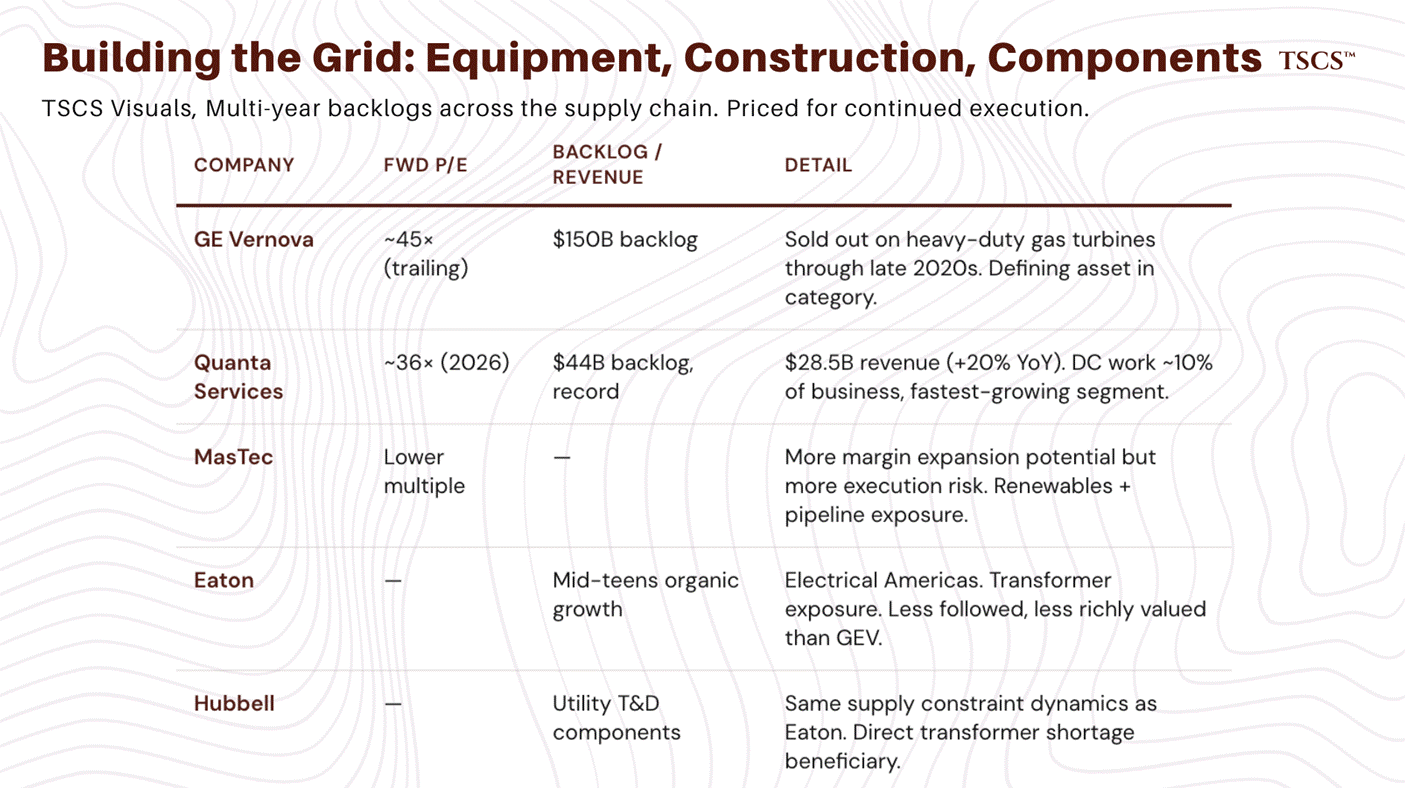
GE Vernova is the defining asset in this category, and arguably the single company most directly leveraged to the deficit thesis across the entire value chain. The numbers are, frankly, extraordinary: a $150 billion total backlog (up $31 billion year-over-year), a gas turbine pipeline that reached 83 GW by year-end 2025 (up from 62 GW one quarter earlier) with a target of 100 GW under contract by year-end 2026, and revenue guidance of $44 to $45 billion for 2026 with adjusted EBITDA margins of 11 to 13%. The company is effectively sold out on heavy-duty gas turbines through the late 2020s, with new slot reservations pricing 10 to 20 points above existing backlog levels. CEO Scott Strazik has stated he expects reservations to be sold out through 2030 by the end of 2026.
The market cap is approximately $216 billion. At roughly 45x trailing earnings and 33x EV/EBITDA on a 2026 basis, GE Vernova is priced for perfection. The bull case is that trailing earnings dramatically understate the company’s earnings power as higher-priced backlog converts into recognized revenue through 2027 and 2028, with management guiding to at least $56 billion in revenue by 2028 and 20% adjusted EBITDA margins. If the company hits those targets, the forward multiple on 2028 earnings looks considerably more reasonable than the trailing multiple suggests. The bear case centers on the Wind segment (projected losses of approximately $400 million in 2026), execution risk on the manufacturing ramp, and the possibility that a supply-chain-constrained industrial compounder cannot sustain a 45x multiple even if it delivers on earnings. The offshore wind stop-work order and tariff headwinds add near-term uncertainty.
The analytically important point is this: GE Vernova’s backlog provides something exceedingly rare in capital goods, which is multi-year revenue visibility decoupled from the economic cycle. Turbine orders are not cancellable in the same way consumer discretionary demand is.
The real question is not whether the revenue materializes. It will. The question is at what margin, and whether a 45x multiple can survive the transition from ‘scarcity story’ to ‘execution story.’ In my experience, it rarely does.
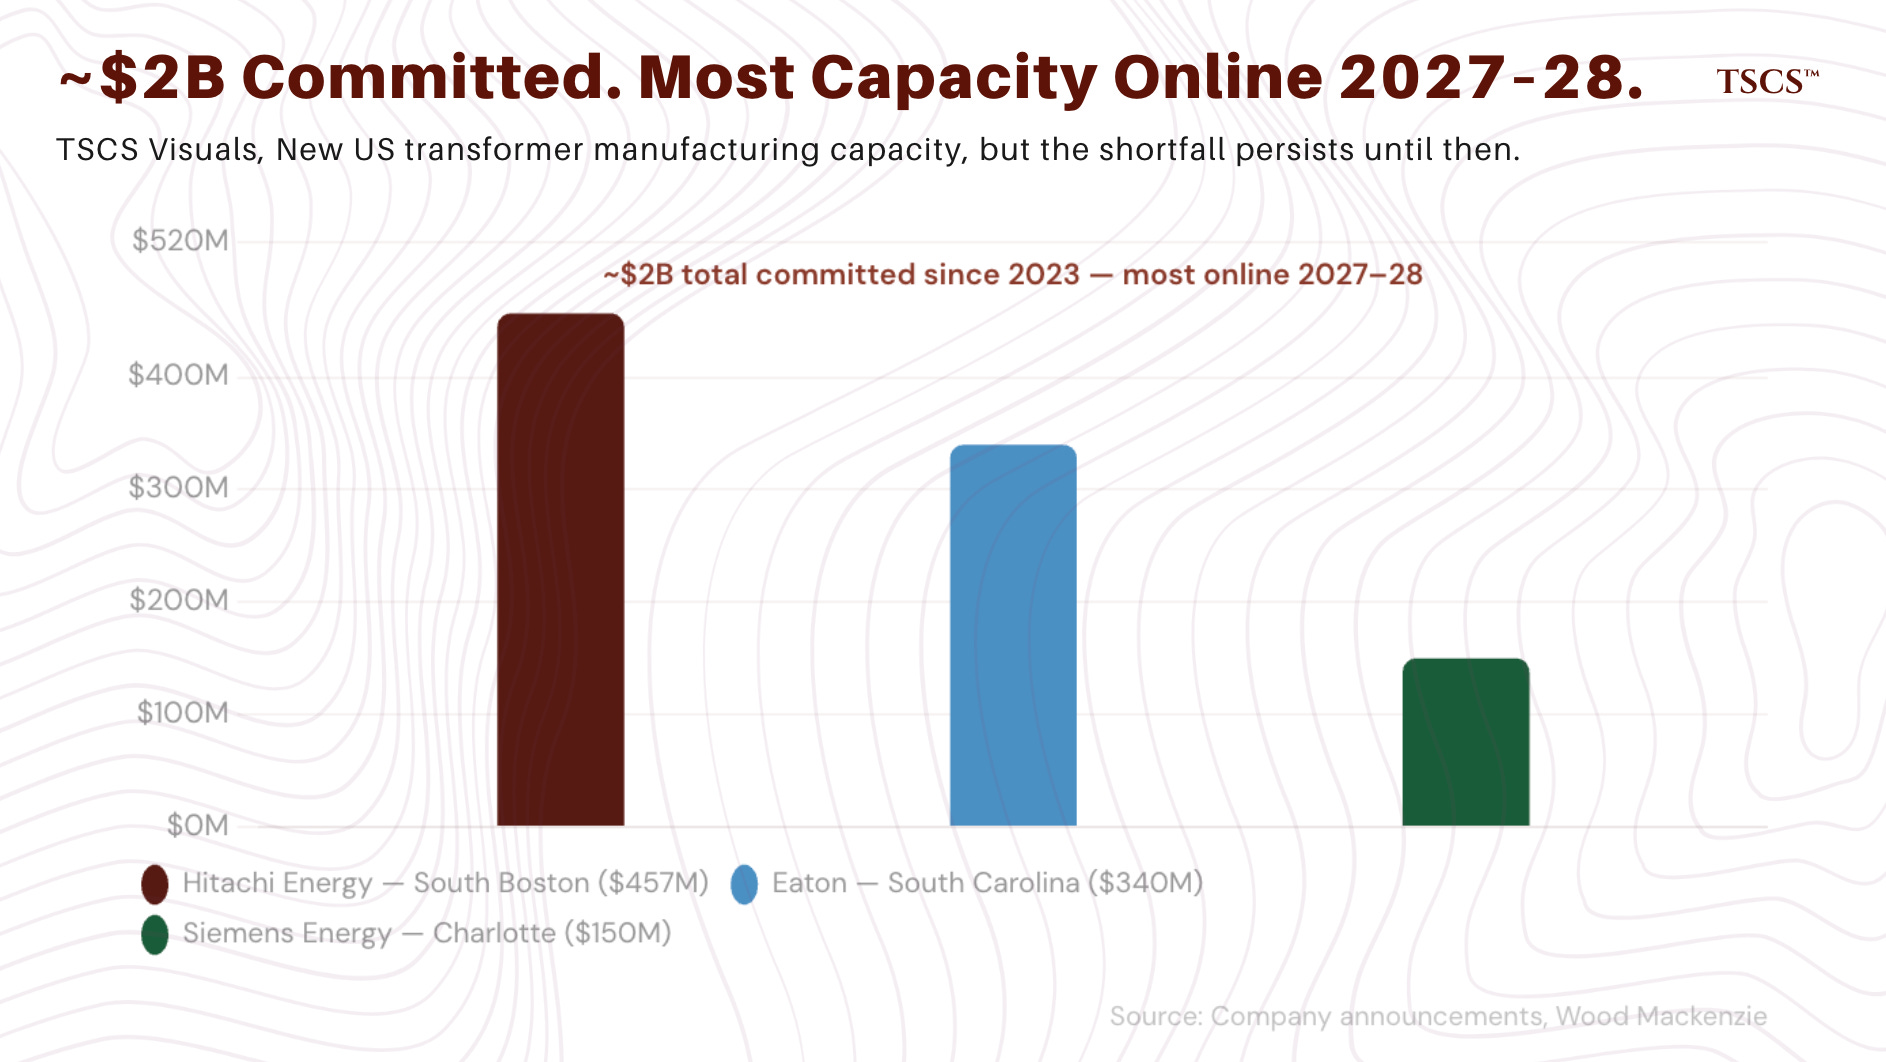
The transformer bottleneck is a critical sub-theme that the market has not fully priced. Wood Mackenzie estimates a 30% supply shortfall for power transformers in 2025, with lead times for large power transformers averaging 128 weeks and generator step-up units averaging 144 weeks. Demand for generator step-up transformers has grown 274% since 2019. Manufacturers have committed nearly $2 billion in new US transformer capacity since 2023, including Hitachi Energy’s $457 million South Boston facility, Siemens Energy’s $150 million Charlotte plant, and Eaton’s $340 million South Carolina expansion, but most of this capacity does not come online until 2027 or 2028.

The companies with the most direct transformer exposure, Eaton (diversified electrical equipment) and Hubbell (utility T&D components), are less followed and less richly valued than GE Vernova but benefit from the same supply constraint dynamics. Eaton’s Electrical Americas segment has seen mid-teens organic growth, and its backlog provides multi-year visibility. The transformer shortage also means that even when generation capacity is approved and financed, it can be delayed by equipment unavailability, extending the deficit and prolonging the scarcity premium for existing assets.
Quanta Services and MasTec represent the labor and construction execution layer. Quanta reported record 2025 revenue of $28.5 billion (up 20% year-over-year), a record $44 billion backlog, and guided 2026 revenue of $33.3 to $33.8 billion with adjusted EPS of $12.65 to $13.35. Data center-related work now represents roughly 10% of the business and is the fastest-growing portion of backlog. At a forward P/E of approximately 36x, Quanta is priced for continued double-digit earnings growth. The risk is that engineering and construction margins are inherently more cyclical and execution-dependent than equipment manufacturing margins. Labor availability, project timing, and weather all introduce volatility. MasTec, at a lower valuation, offers more margin expansion potential but also more execution risk given its exposure to renewables and pipeline construction, segments where policy uncertainty is higher.
Natural gas infrastructure: the midstream pivot nobody expected
If I had to pick one part of this piece that will age best, it is this section. The most analytically interesting development in the deficit story over the past twelve months is the emergence of midstream natural gas companies as direct participants in the power generation value chain. The market has barely noticed. It should.
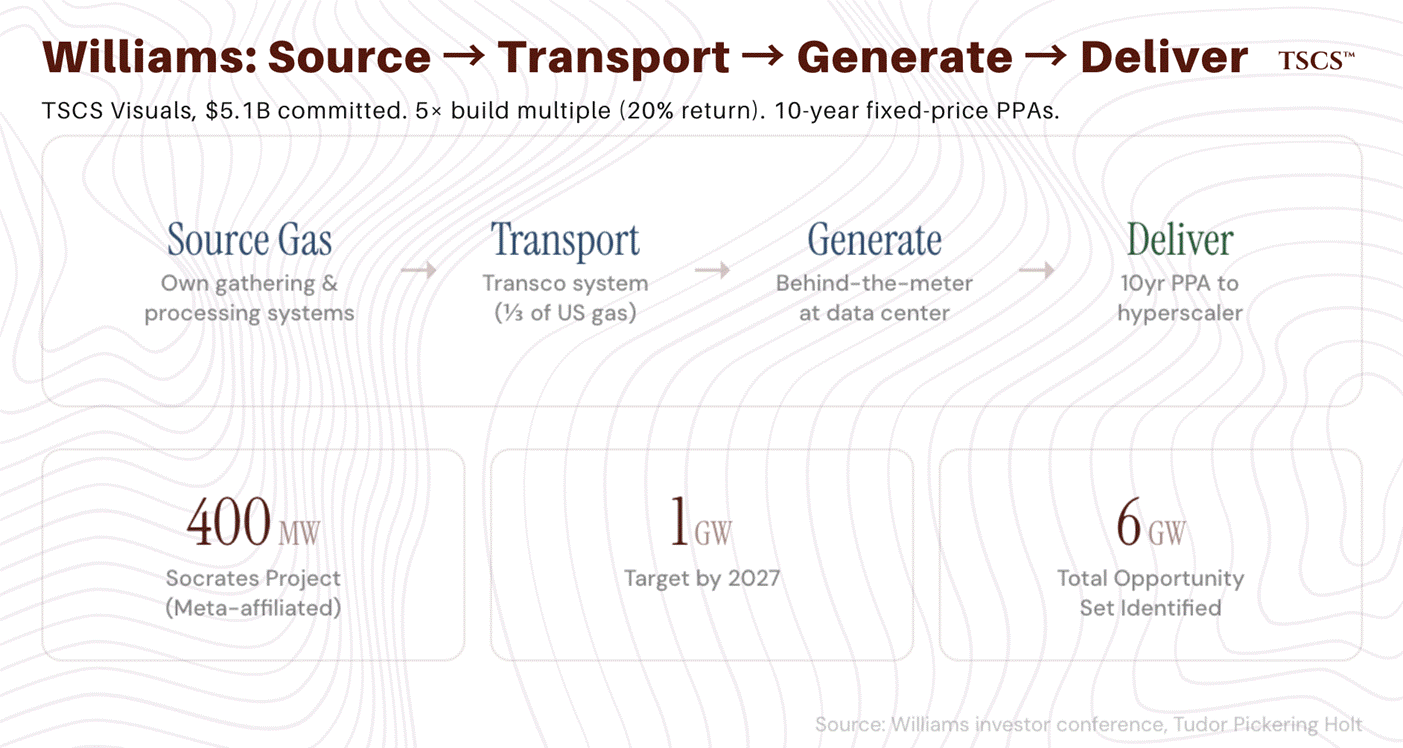
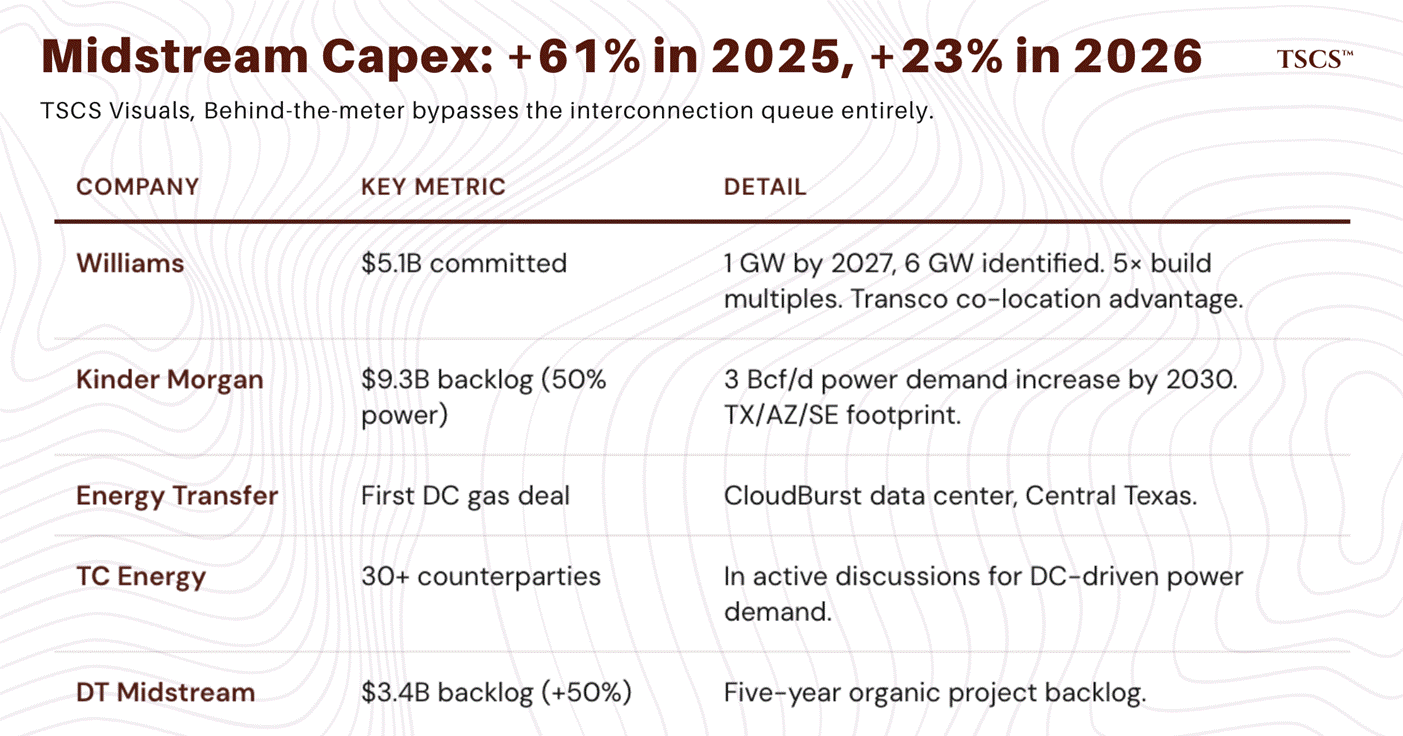
Williams Companies is the clearest example. The company has committed $5.1 billion to modular gas-fired and hybrid power plants designed to serve data centers and industrial loads in grid-constrained areas. Its Socrates project in New Albany, Ohio, a 400 MW facility serving a Meta-affiliated data center, is backed by a 10-year fixed-price PPA and expected to deliver a roughly 5x build multiple (implying a 20% return). Williams has ordered equipment for additional behind-the-meter projects targeting 1 GW of capacity by 2027, with a total opportunity set of 6 GW identified. The company’s Transco system, which transports roughly one-third of US natural gas, provides unique co-location advantages, as pipeline routes include significant fiber network co-location.
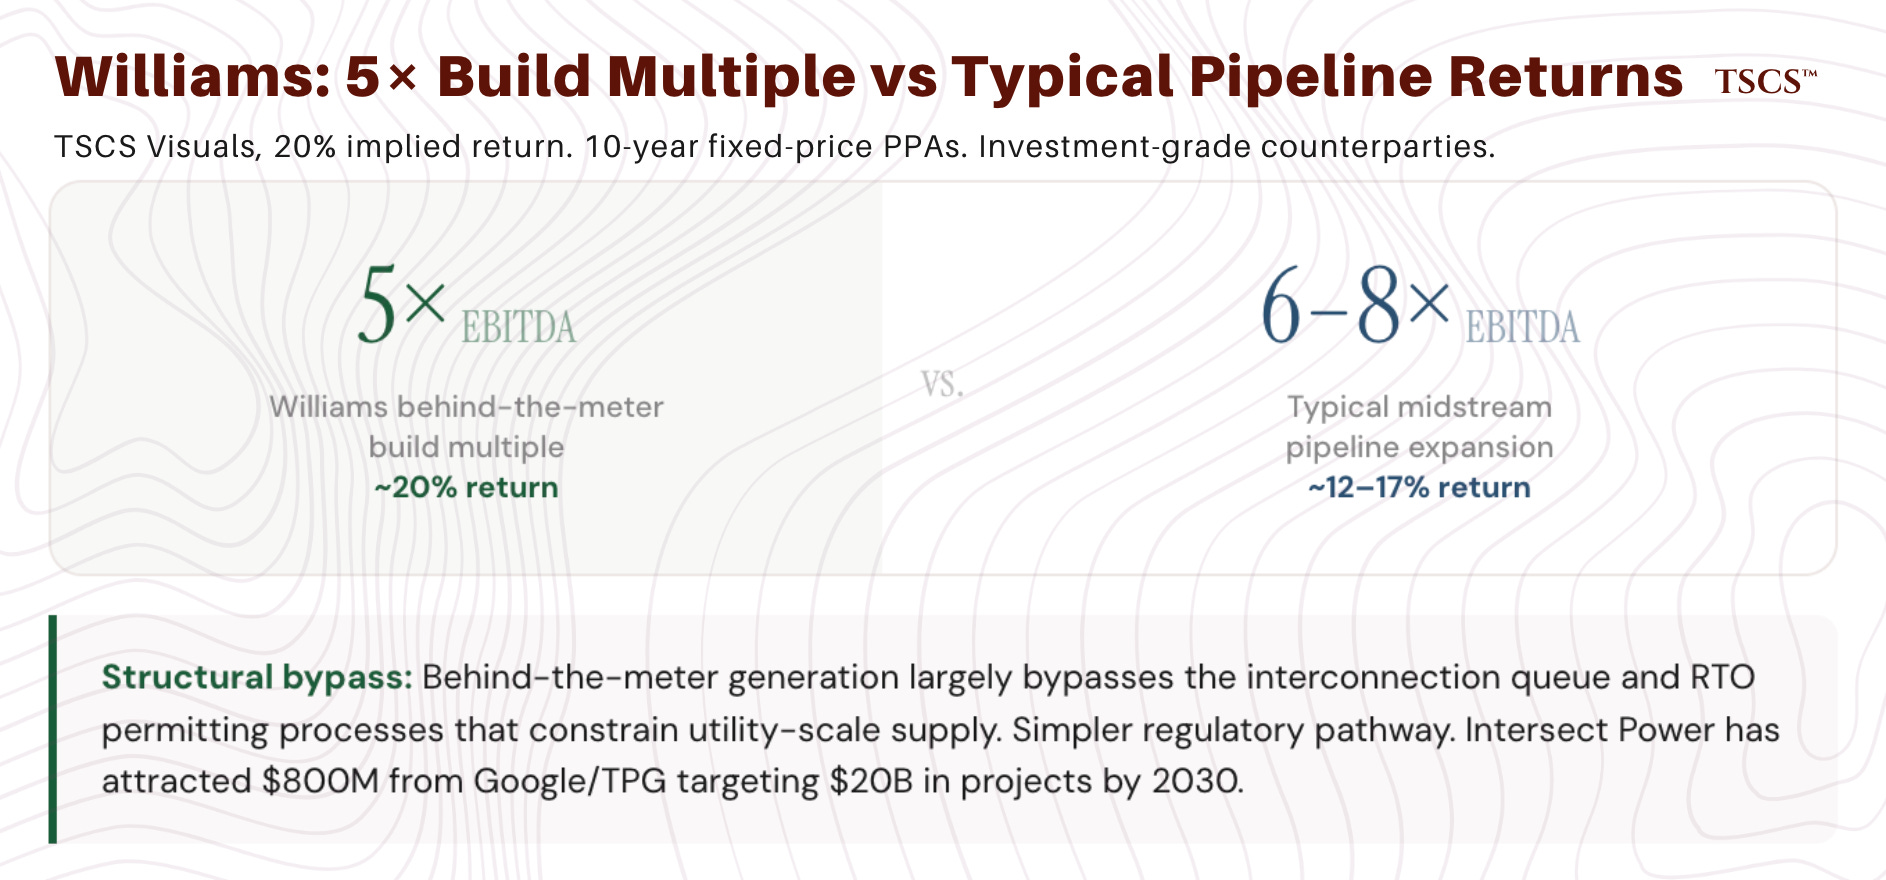
The strategic logic is compelling. Williams can source gas from its own gathering and processing systems, transport it through its own pipelines, and convert it to electricity at or near the data center, capturing value at every stage. The 10-year PPA structure provides revenue certainty that traditional midstream contracts increasingly lack, and the build multiples (5x EBITDA) imply returns that exceed typical pipeline expansion economics. Williams’ pipeline to power strategy effectively transforms it from a commodity transporter into an integrated energy solutions provider with locked-in returns.
The Pipeline Podcast Network’s 2026 predictions episode captured the practitioner view. Host Russel Treat noted that as new needs for gas emerge, operators are “looking at how to de-bottleneck and up-pressure older systems because that’s going to be easier to get done than building some major new infrastructure project.” This is a critical operational detail the institutional research misses: the near-term gas supply response is not new pipelines (which face their own permitting timelines) but optimization of existing systems.
Williams CFO Chad Zamarin, speaking at an investor conference, described the company’s strategy as “sticking to our knitting and to where we have strength and expertise,” noting that the behind-the-meter model allows Williams to bypass the very interconnection and permitting constraints that delay grid-scale development. Tudor, Pickering, Holt analyst Zack Van Everen described the Williams deals as “positive, as Williams continues to execute large power projects with shorter timelines and lower build multiples than most midstream projects across our coverage.” NGI’s Patrick Rau predicted that “actual project announcements” would dominate earnings calls, noting “deals are starting to happen, and are happening quickly.”
Kinder Morgan is pursuing a complementary but distinct strategy, forecasting a 3 Bcf/d increase in natural-gas-fired power demand by 2030. Approximately 50% of its $9.3 billion project backlog is now dedicated to serving power demand, including the South System Expansion 4 in the Southeast and the Mississippi Crossing project. The company’s geographic footprint in Texas, Arizona, and the Southeast positions it directly in the path of the highest data center growth markets.
The broader midstream sector is pivoting in the same direction. Energy Transfer struck its first deal to supply natural gas directly to a data center (CloudBurst in Central Texas). TC Energy is in discussions with over 30 counterparties to serve data center-driven power demand. DT Midstream boosted its five-year organic project backlog by 50% to $3.4 billion. Fitch Ratings noted that after increasing capital expenditures by 61% in 2025, midstream firms are expected to increase investment by another 23% in 2026.
The underappreciated investment angle here is that midstream companies offer deficit exposure with structural protections that most power-sector plays lack. Revenue is underpinned by long-term, fixed-price contracts (typically 10 to 20 years). Counterparties are predominantly investment-grade hyperscalers. Capital requirements for pipeline expansions and behind-the-meter generation are modest relative to new utility-scale power plants. And the regulatory pathway is considerably simpler, behind-the-meter generation largely bypasses the interconnection queue and RTO permitting processes that constrain the utility-scale supply response. For allocators seeking deficit exposure with lower volatility and more contractual certainty than merchant generators provide, the midstream pivot deserves serious attention.
I do not want to oversell this. Williams’ 1 GW target by 2027 is meaningful for the company but a rounding error relative to the grid-wide deficit NERC projects. Midstream companies are building for specific customers with specific contracts; they are not solving the grid-wide supply gap. The investment case depends on sustained deal flow from hyperscalers, and the pace of new contract announcements through 2026 will be the critical monitoring variable.
Data center REITs and hyperscalers: the demand side of the equation
The data center REITs, primarily Equinix and Digital Realty, occupy an unusual position in the deficit value chain. They are simultaneously the companies whose growth is most directly constrained by the power shortage and the companies whose capital commitments most directly validate the demand forecasts underpinning the rest of the thesis.
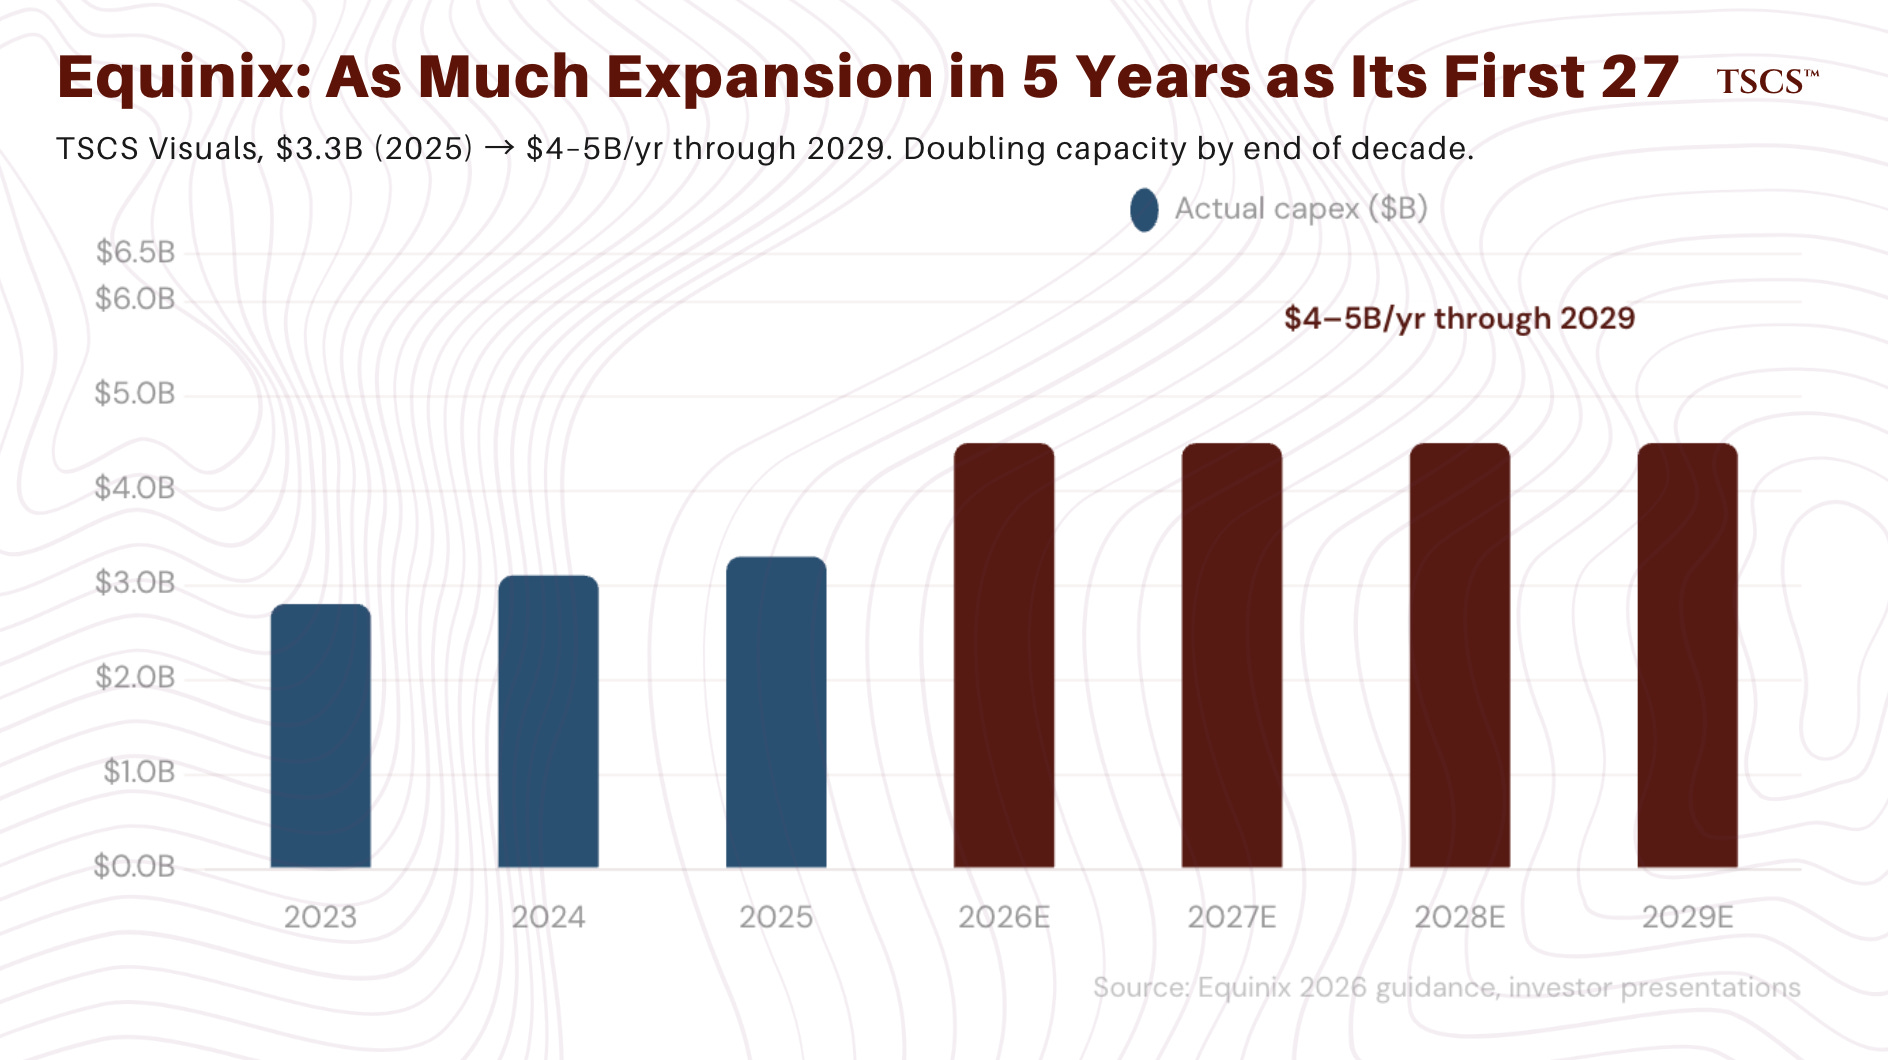
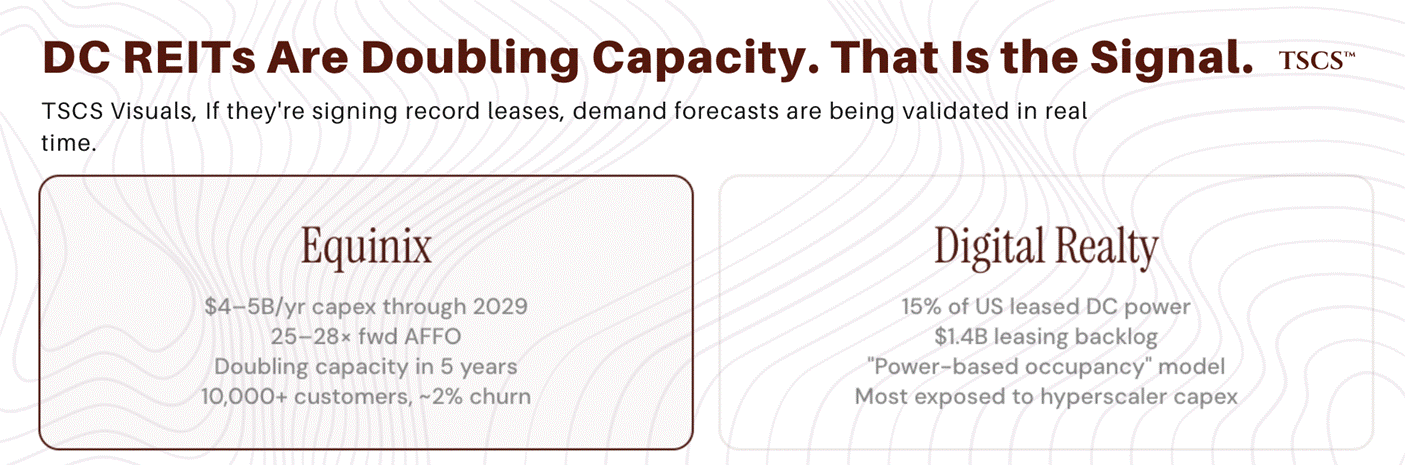
Equinix recently reported a 14% single-day share price jump, its largest since 2012, following 2026 guidance that exceeded Wall Street expectations. The company plans to invest $4 to $5 billion annually through 2029, up from $3.3 billion in 2025, aiming to double its capacity by the end of the decade (as much expansion in five years as in its first 27 years). At approximately 25 to 28x forward AFFO, Equinix trades at a persistent premium to data center peers, justified by its 10,000+ customer base, 500,000+ interconnections, and industry-low churn of approximately 2%. The inference pivot, where AI models move from training to deployment and need to be close to end users, plays directly to Equinix’s retail colocation strengths.
Digital Realty holds the largest share of leased data center power in the US (15%) and has transitioned to a “power-based occupancy model” to better reflect what is actually scarce. Its $1.4 billion leasing backlog and wholesale-oriented model mean it is more directly exposed to hyperscaler capex decisions than Equinix.
I think of the data center REITs less as investment opportunities in themselves (though both have performed well) and more as the best forward indicators we have for the deficit thesis. If Equinix and Digital Realty are doubling capacity commitments and reporting record bookings, the demand forecasts that underpin the rest of the value chain are being validated in real time by the entities actually signing the leases. Conversely, any deceleration in REIT leasing velocity or capex guidance would be the earliest signal that demand is moderating, and should be watched closely.
The critical insight that most analysis misses: power availability has become the primary constraint on data center REIT growth, not silicon supply, not customer demand, not capital availability. Power. Both companies are now exploring behind-the-meter solutions, including on-site gas turbines and modular nuclear, to bypass grid constraints. This ‘grid bypass’ trend is itself a powerful confirmation of the deficit thesis, but it introduces a tension the rest of this analysis must acknowledge. If enough hyperscale demand moves behind the meter, the load growth driving the deficit thesis partially migrates off-grid, reducing the total addressable market for grid-connected power producers.
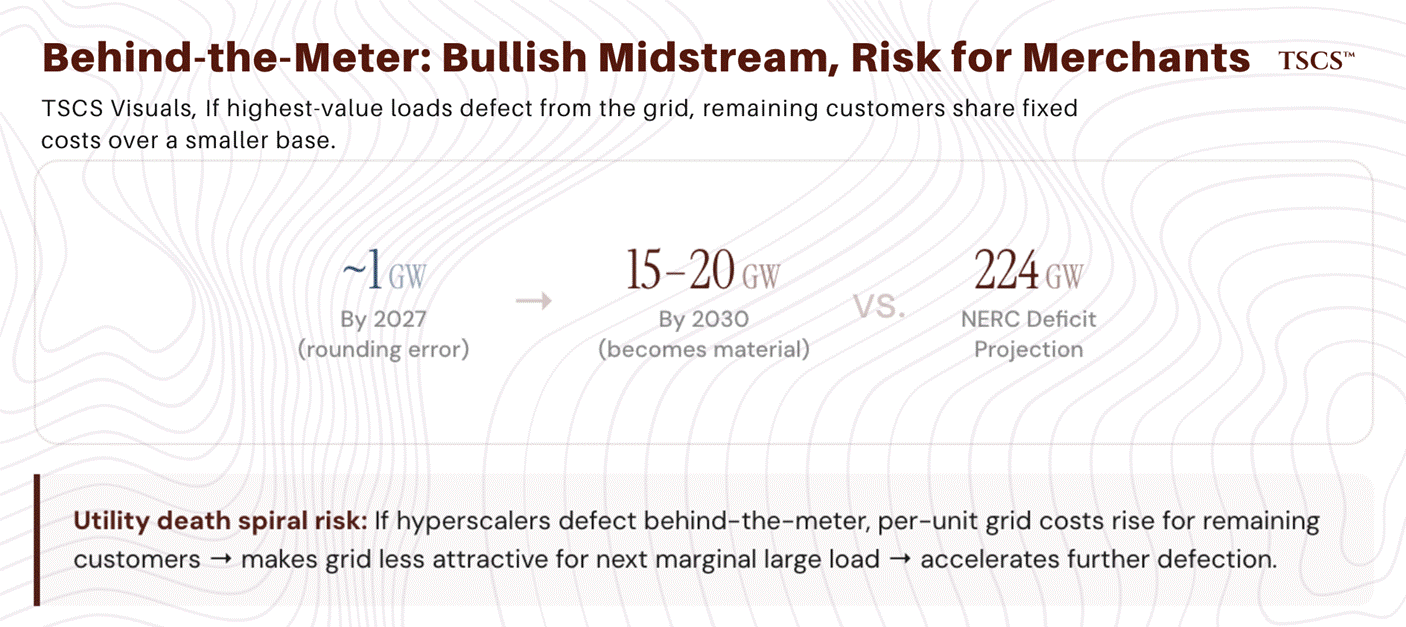
The resolution, at least for the next five years, is that behind-the-meter migration shrinks the grid-connected deficit but does not eliminate it, and may actually worsen affordability pressures for remaining grid customers. Here is why: behind-the-meter generation serves the largest, most price-insensitive loads (hyperscalers with $200+ billion capex budgets). The loads that remain grid-dependent, residential customers, small commercial users, legacy industrial facilities, still need the same reliability infrastructure but now share its fixed costs across a smaller revenue base. This is the utility ‘death spiral’ dynamic in a new form: if the highest-value customers defect from the grid, the per-unit cost of maintaining the grid rises for everyone else, which makes the grid even less attractive for the next marginal large load, which accelerates further defection.
For capital allocation, the implication is that behind-the-meter migration is bullish for midstream companies (who enable the bypass) and for regulated utilities in territories where large loads cannot easily defect (the vertically integrated Southeast), but represents a long-tail risk for merchant generators in PJM and ERCOT whose scarcity premium depends on grid-connected demand growth. The risk is not imminent, but if behind-the-meter capacity reaches 15 to 20 GW by 2030, it becomes material enough to compress the grid-connected deficit and the scarcity premiums attached to it.
The Catalyst podcast, hosted by Shayle Kann of Energy Impact Partners, has produced the best ground-level interviews on this topic. In a September 2025 episode, Intersect Power CEO Sheldon Kimber stated flatly: “The grid is broken, at least for new data centers and other large, industrial loads that need lots of clean power, fast.” His solution, colocating behind-the-meter generation with data centers rather than waiting for grid connections, has attracted $800 million in investment from Google and TPG, with a target of catalyzing $20 billion in projects by 2030. The logic: instead of bringing clean generation to load, bring load to clean generation.
In a separate episode, Digital Realty CTO Chris Sharp described how interconnection delays and equipment bottlenecks are reshaping development strategy: bridge power (using temporary on-site generators until grid connections materialize) is becoming a standard planning tool rather than an emergency measure. EPRI’s DCFlex demonstration at an Oracle data center in Phoenix in July 2025 showed that data centers can reduce load 25% during peak demand, and Google subsequently expanded demand response agreements with Michigan Power and TVA, suggesting that the demand side is beginning to develop its own flexibility mechanisms rather than passively waiting for the grid to catch up.
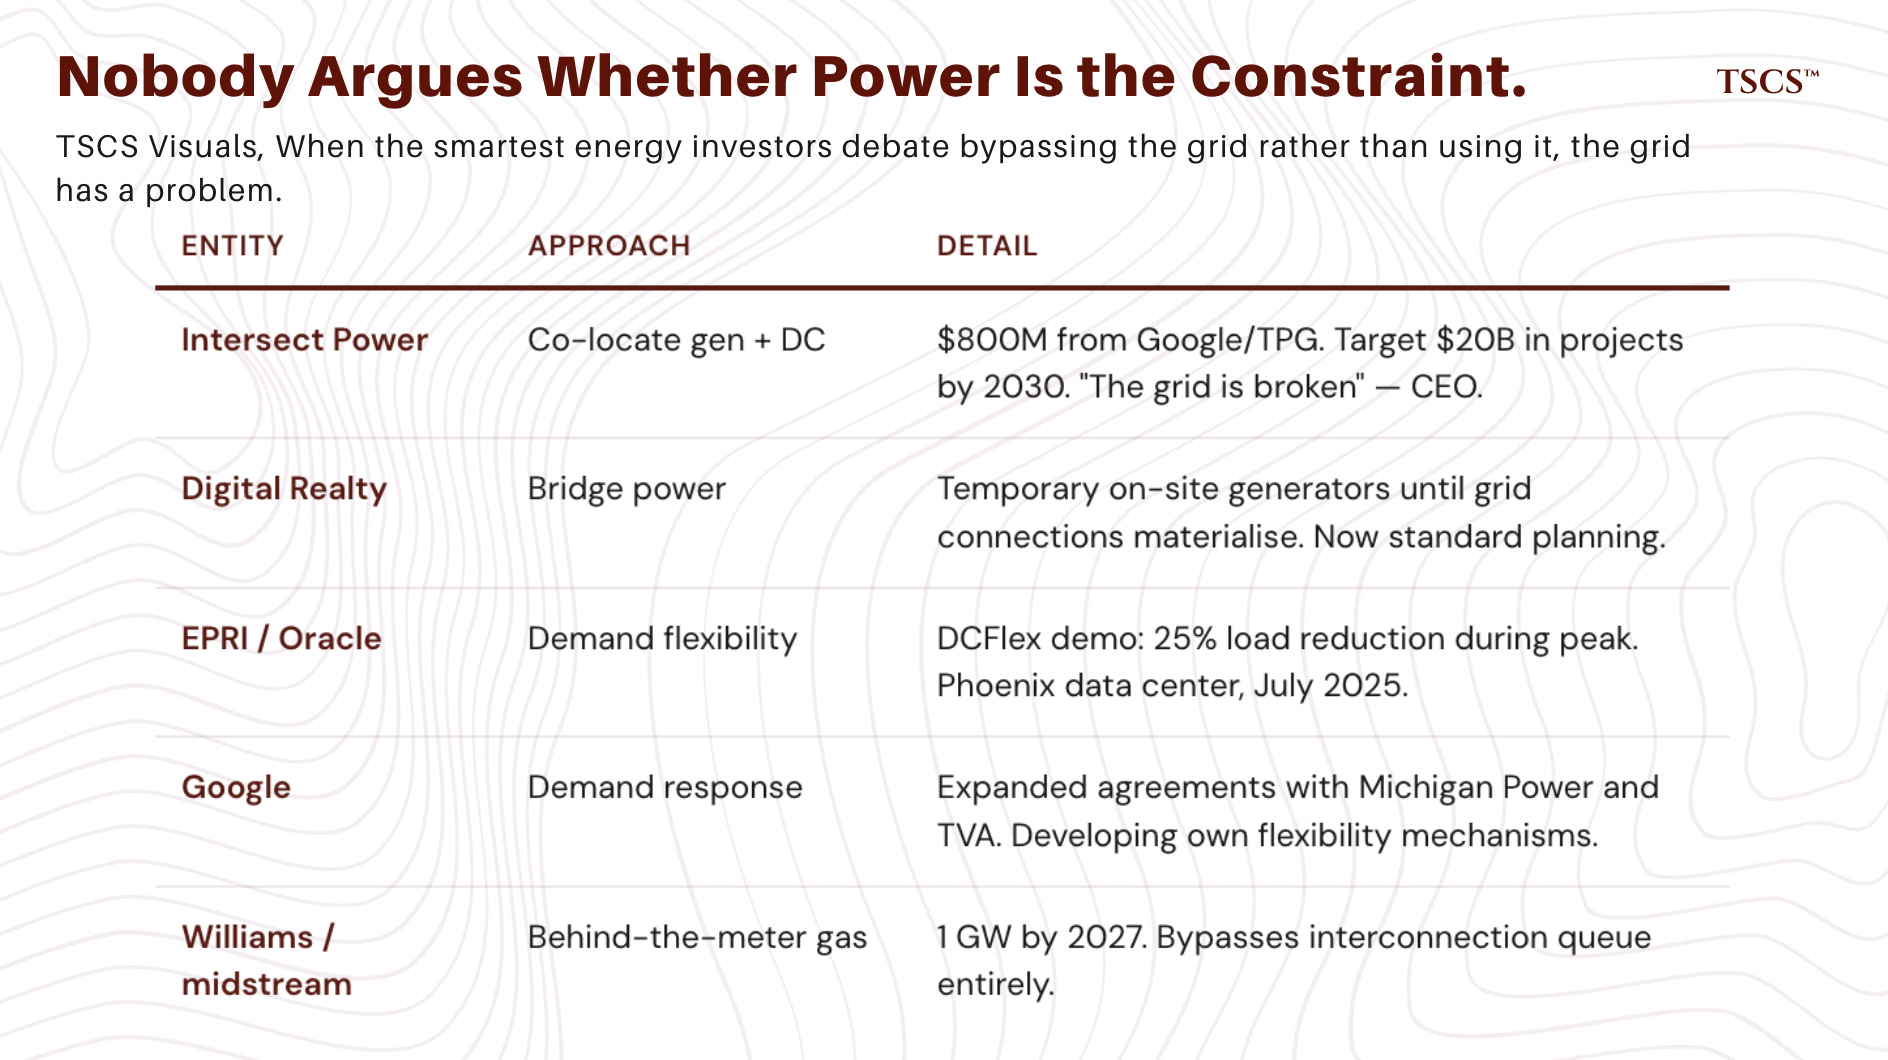
Brian Janous, co-founder of Cloverleaf Infrastructure and former Microsoft energy lead, offered the counterpoint on Catalyst in September 2025: colocation sounds elegant but faces its own gas supply constraints, added complexity and cost, and permitting challenges that mirror grid-scale development. Both Janous and Kann expressed skepticism about on-site nuclear as a near-term solution. The debate between colocation advocates and grid-reliance advocates is itself the most telling evidence of the deficit. Nobody is arguing about whether power is the binding constraint. They are arguing about which pathway around it is faster. When the smartest energy infrastructure investors in the country are debating how to bypass the grid rather than how to use it, the grid has a problem.
The short side: what is overpriced or structurally impaired
I have spent most of this piece on the long side. But a complete framework requires identifying what is harmed by the deficit, and what the market has overpriced.
Pure-play renewable developers face a structural squeeze. The interconnection queue is dominated by solar, wind, and storage projects, but the completion rate for queued projects is 15 to 20% nationally, and average time from application to commercial operation exceeds four years across most RTOs. Meanwhile, the current administration’s hostility toward renewable tax credits and permitting preference for thermal generation creates additional policy headwind. Companies whose earnings depend on new renewable project development face a widening gap between their announced pipelines and their ability to execute. This does not mean renewables are uninvestable, but it means that developers trading at multiples predicated on aggressive project completion timelines face valuation risk if interconnection delays persist.
Legacy coal generators are a value trap. The DOE’s emergency orders preventing plant retirements have kept some coal facilities online, and the current administration’s rhetoric is supportive. But the economic fundamentals are unambiguous: coal’s levelized cost of energy is uncompetitive with gas and renewables in virtually every market, and coal plants require ongoing capital expenditure to maintain operations.
Coal capacity is declining because it is uneconomic, and no amount of political support changes the fundamental cost arithmetic. Be deeply skeptical of any coal-exposed thesis that depends on sustained federal intervention to keep plants running. Emergency orders are, by definition, temporary. The economics are not.
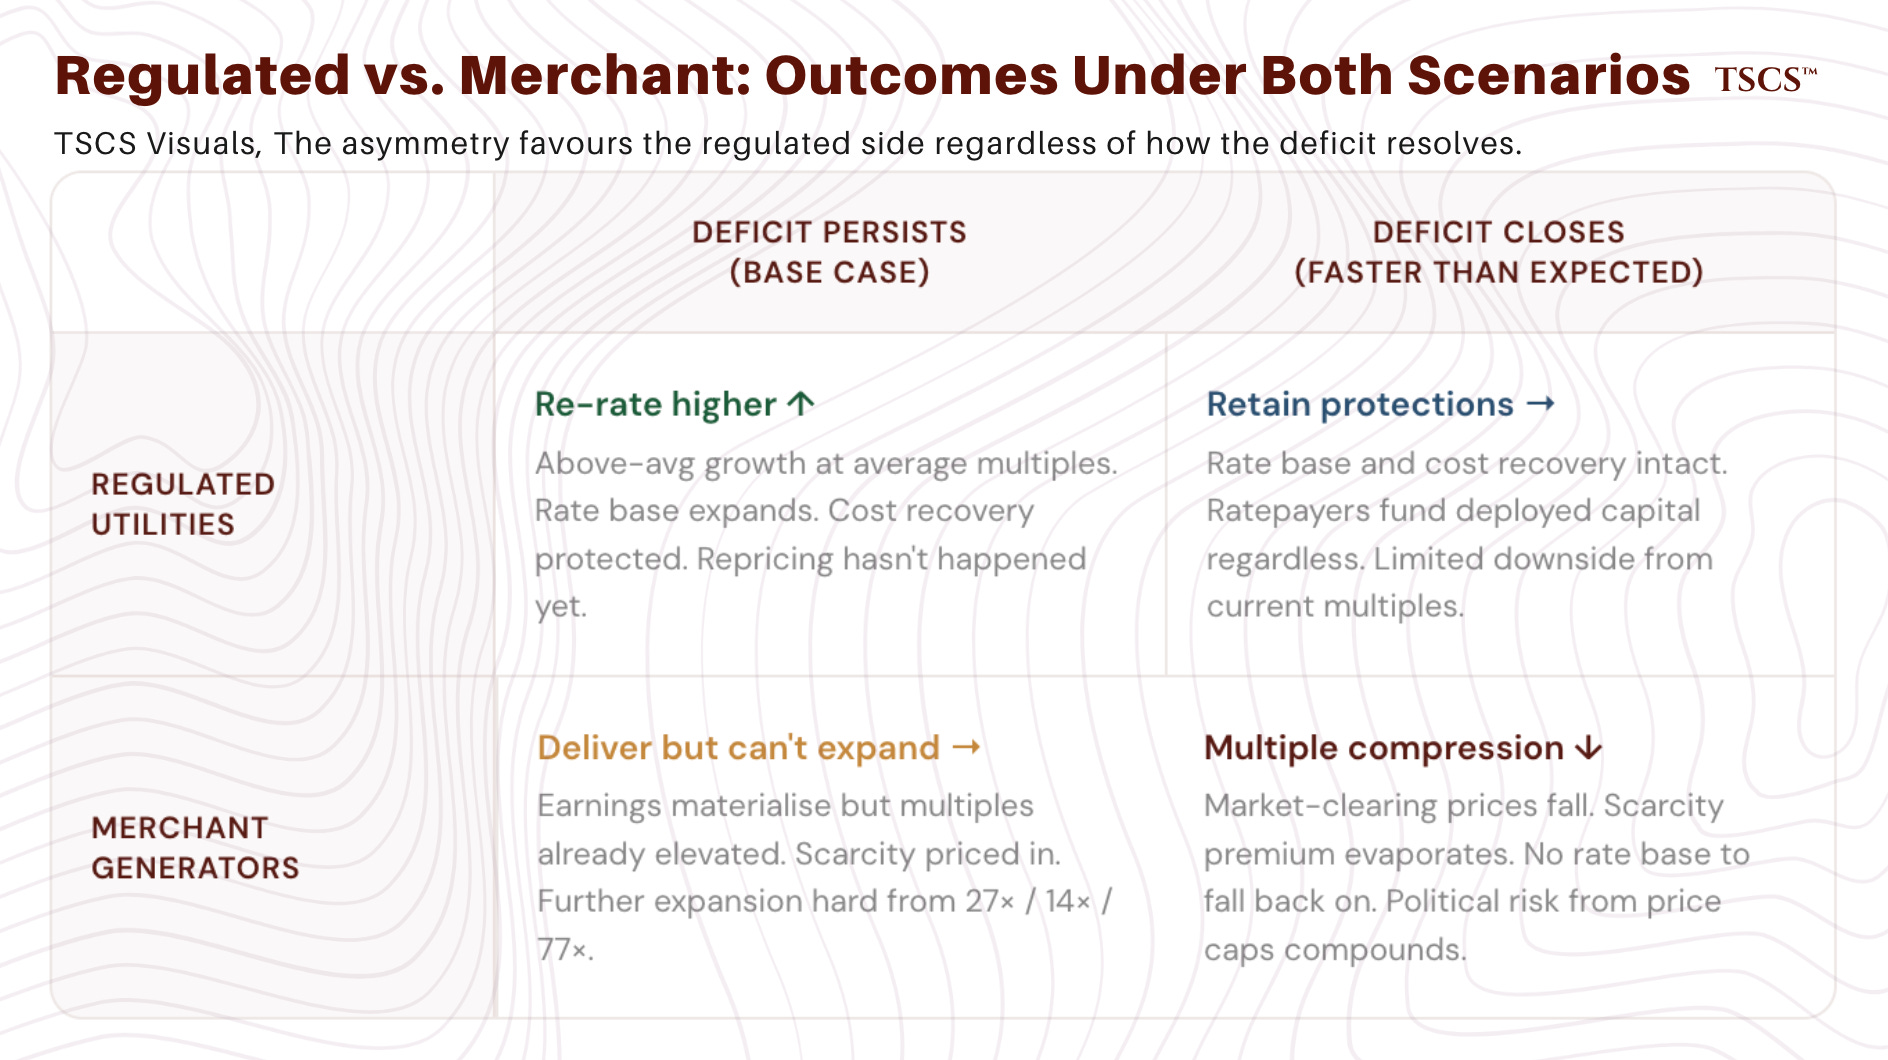
The most interesting pair trade in the grid deficit space is long regulated utilities versus short merchant generators on a relative basis. This is not a directional bet on the deficit (both benefit) but a bet on where the market has mispriced the duration and risk-adjusted return profile. Regulated utilities trade at historically average multiples despite above-average growth. Merchant generators trade at historically elevated multiples that price in sustained scarcity. If the deficit persists as expected, regulated utilities re-rate higher while merchant generators deliver earnings but struggle to expand multiples further from already-elevated levels. If the deficit closes faster than expected, merchant generators face multiple compression while regulated utilities retain their rate base and cost recovery protections. The asymmetry favors the regulated side. The merchant generators have captured the most dramatic repricing; the regulated utilities have not yet captured theirs.
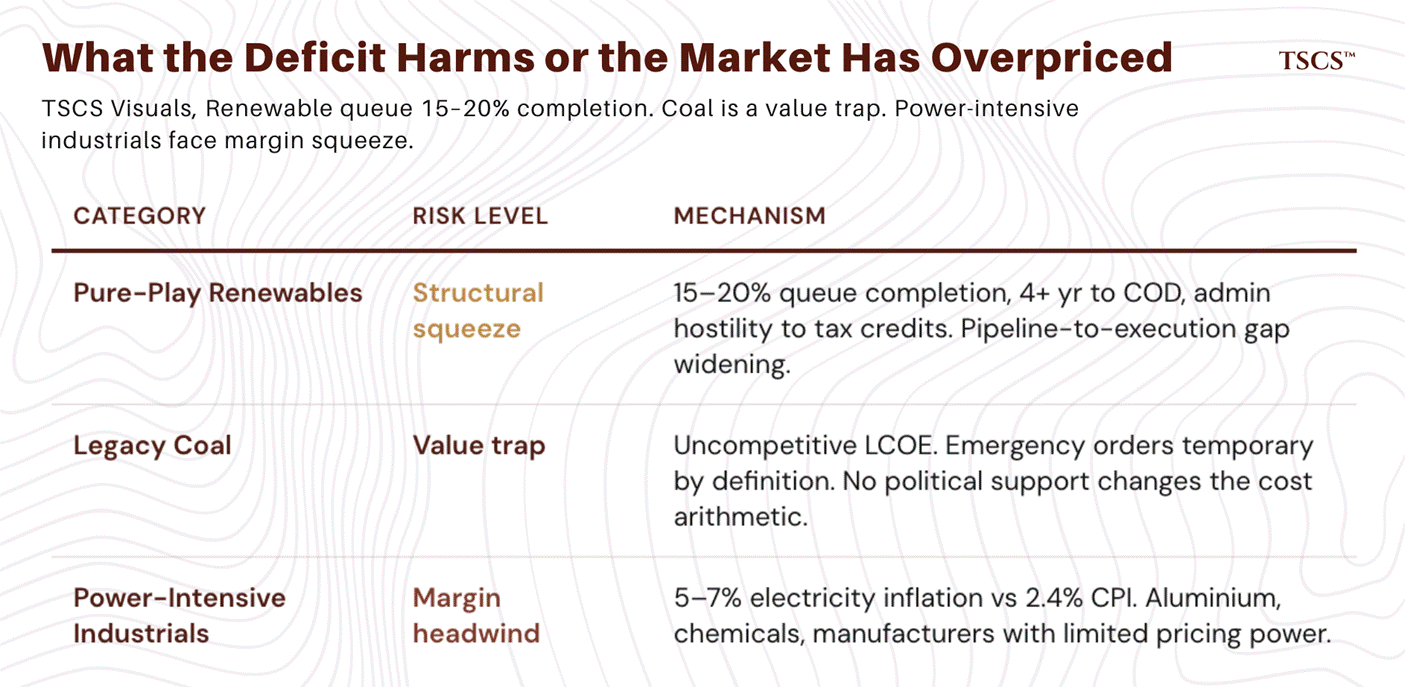
A second structural short worth consideration: companies whose margins depend on cheap, abundant power that is no longer cheap or abundant. This includes certain energy-intensive industrial manufacturers, aluminum smelters, and chemical producers with limited ability to pass through rising electricity costs. Electricity price increases of 5 to 7% against 2.4% general inflation represent a margin headwind for any business where power is a significant input cost and pricing power is limited. The near-Columbus, Ohio example cited earlier (residential rates rising roughly 60% in areas with heavy data center concentration) is a preview of what happens to local industrial economics when power becomes a scarce resource allocated by price.
Where the thesis is most and least priced in
Here is how I see the entire opportunity set, summarized. The mismatch between fundamental exposure and current valuation is where the returns concentrate.
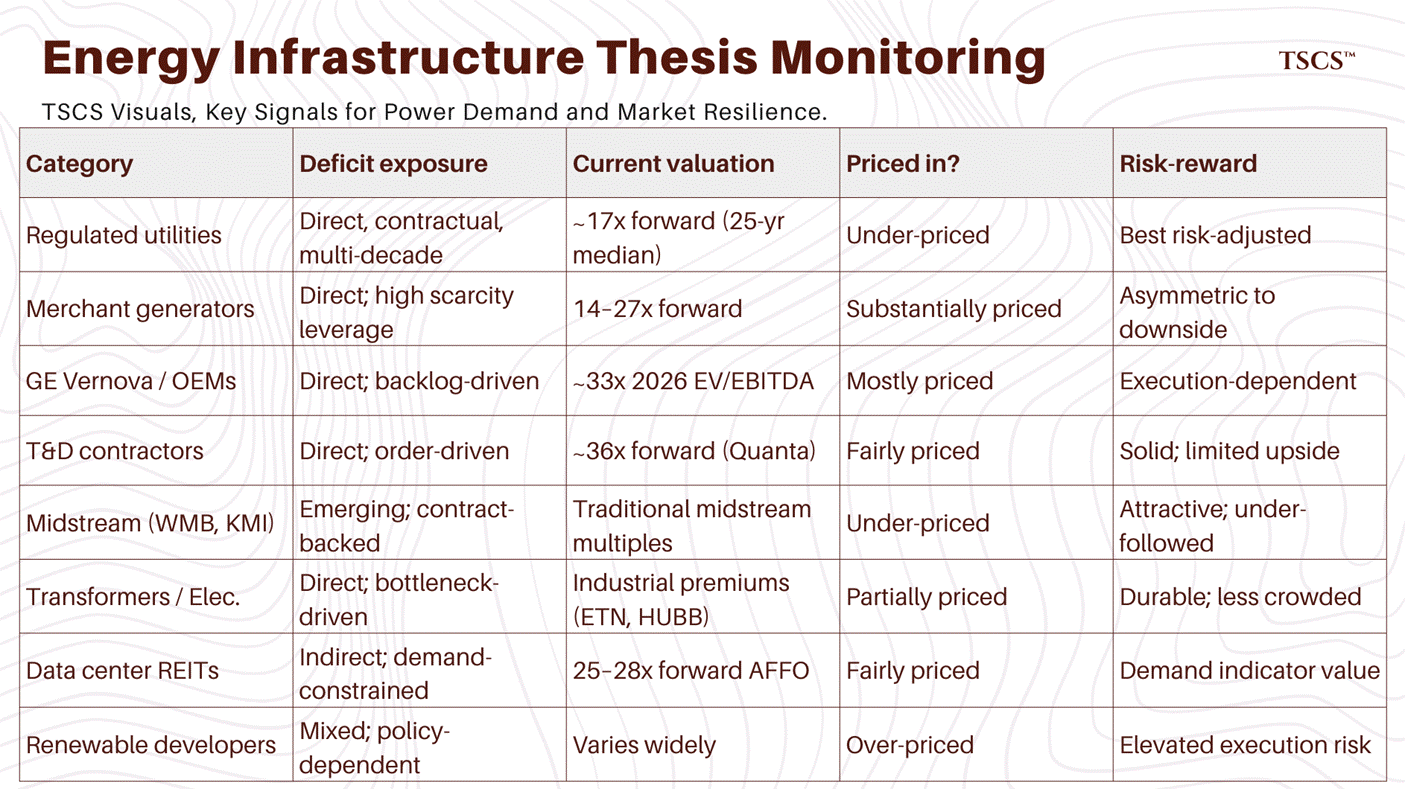
The framework is simple: buy the companies whose earnings growth is driven by the deficit but whose valuations do not yet reflect it. As of early 2026, I think that points most clearly toward regulated utilities and select midstream infrastructure plays. The merchant generators and turbine OEMs have captured the most dramatic repricing, and the market knows it. The next phase of outperformance will come from the less celebrated parts of the value chain, the names where capital is being deployed, returns are contractually protected, and nobody has yet slapped a ‘grid deficit play’ label on the stock. That is where I am looking.
Conclusion: the structural deficit is accelerating, not stabilizing
Three numbers define the US grid in early 2026: 759,180 MW (record coincident peak), 6,623 MW UCAP (PJM's first-ever reliability shortfall), and 224 GW (NERC's projected peak growth over the decade).
In the regulated Southeast, the supply response is underway. In the deregulated markets that serve the majority of US demand, an unprecedented build signal is still waiting for a regulatory process to decide whether it can act.
The difference between a five-year deficit and a ten-year one is the difference between a cyclical trade and a generational capital deployment cycle.
As Luke Gromen has put it, “AI will go where it has electricity.” If the US cannot build generation at the pace required, the question is not whether AI demand moderates, but whether it migrates. I know which one I am positioning for.
Another great one. What I think is missing there is an analysis of the European and Asian equipment manufacturers and how they could benefit from the bottlenecks. Siemens Energy, for example, is a company that benefits even more than GE Vernova, in my view. Similarly, Schneider Electric on the transformer side. These are global markets, and bottlenecks in the US spread.
The article highlights the paradox of interconnection: while a continental grid maximizes efficiency and resource sharing, it introduces systemic fragility. By erasing local boundaries, a single point of failure can now trigger a massive, cascading collapse—proving that we have traded local resilience for high-scale complexity.
In light of this systemic fragility, should we focus on reinforcing our massive centralized grids, or is it time to pivot toward decentralized micro-grids to ensure local survival during a major failure?