

Two Margin Calls
Korean margin debt hit a record ₩38.6 trillion in June. On the Bank of Korea's own heat gauge, that was the 27.6th percentile. Seoul broke anyway.

It’s the 8th of June and you’re long.
Not recklessly long, you’d say.
You run a margin account at one of the big Seoul brokers, the index has been printing free money all spring, and the financed positions in your account look like the financed positions in most leveraged accounts that month, which is to say heavy in 2 semiconductor names and the leveraged products built on them, because that’s what was going up.
By mid-July the 16 single-stock leveraged products the regulator had waved through in May would grow from ₩4.4 trillion to ₩11.9 trillion of market cap in 7 weeks, that’s the FSC’s own count, and Korean press put the margin balance sitting on Samsung and hynix alone near ₩11 trillion.
Today the index falls 8.3%. Your phone pings before lunch. The account has dropped through its maintenance ratio, 140% in a standard account, the regulatory floor, though your broker may run you at 150 or 165 depending on the stock and the size of your book.
Restore the collateral by the end of the next business day, cash, eligible securities, or sell something yourself, or on the morning after that the broker submits the sale into the opening auction for you.
Shit.
And you don’t get to pick what goes. The broker’s waterfall does, and depending on the firm it runs on the financed position that caused the shortfall or the earliest loan date, KB ranks by a formula measuring which sale best repairs the account.
Which means the thing that gets sold is, often enough, the concentrated semiconductor position that broke the account in the first place, submitted into the opening auction alongside everyone else’s, at whatever price the auction finds.
You wire the cash. Plenty of people don’t. A Goldman desk note dated the 16th of July counted more than 1.2 million leveraged accounts triggering margin calls by the 13th, accounts, not people, and that was only the first leg.
And then the market does the cruellest thing it can do to a person in your position. It rewards you.
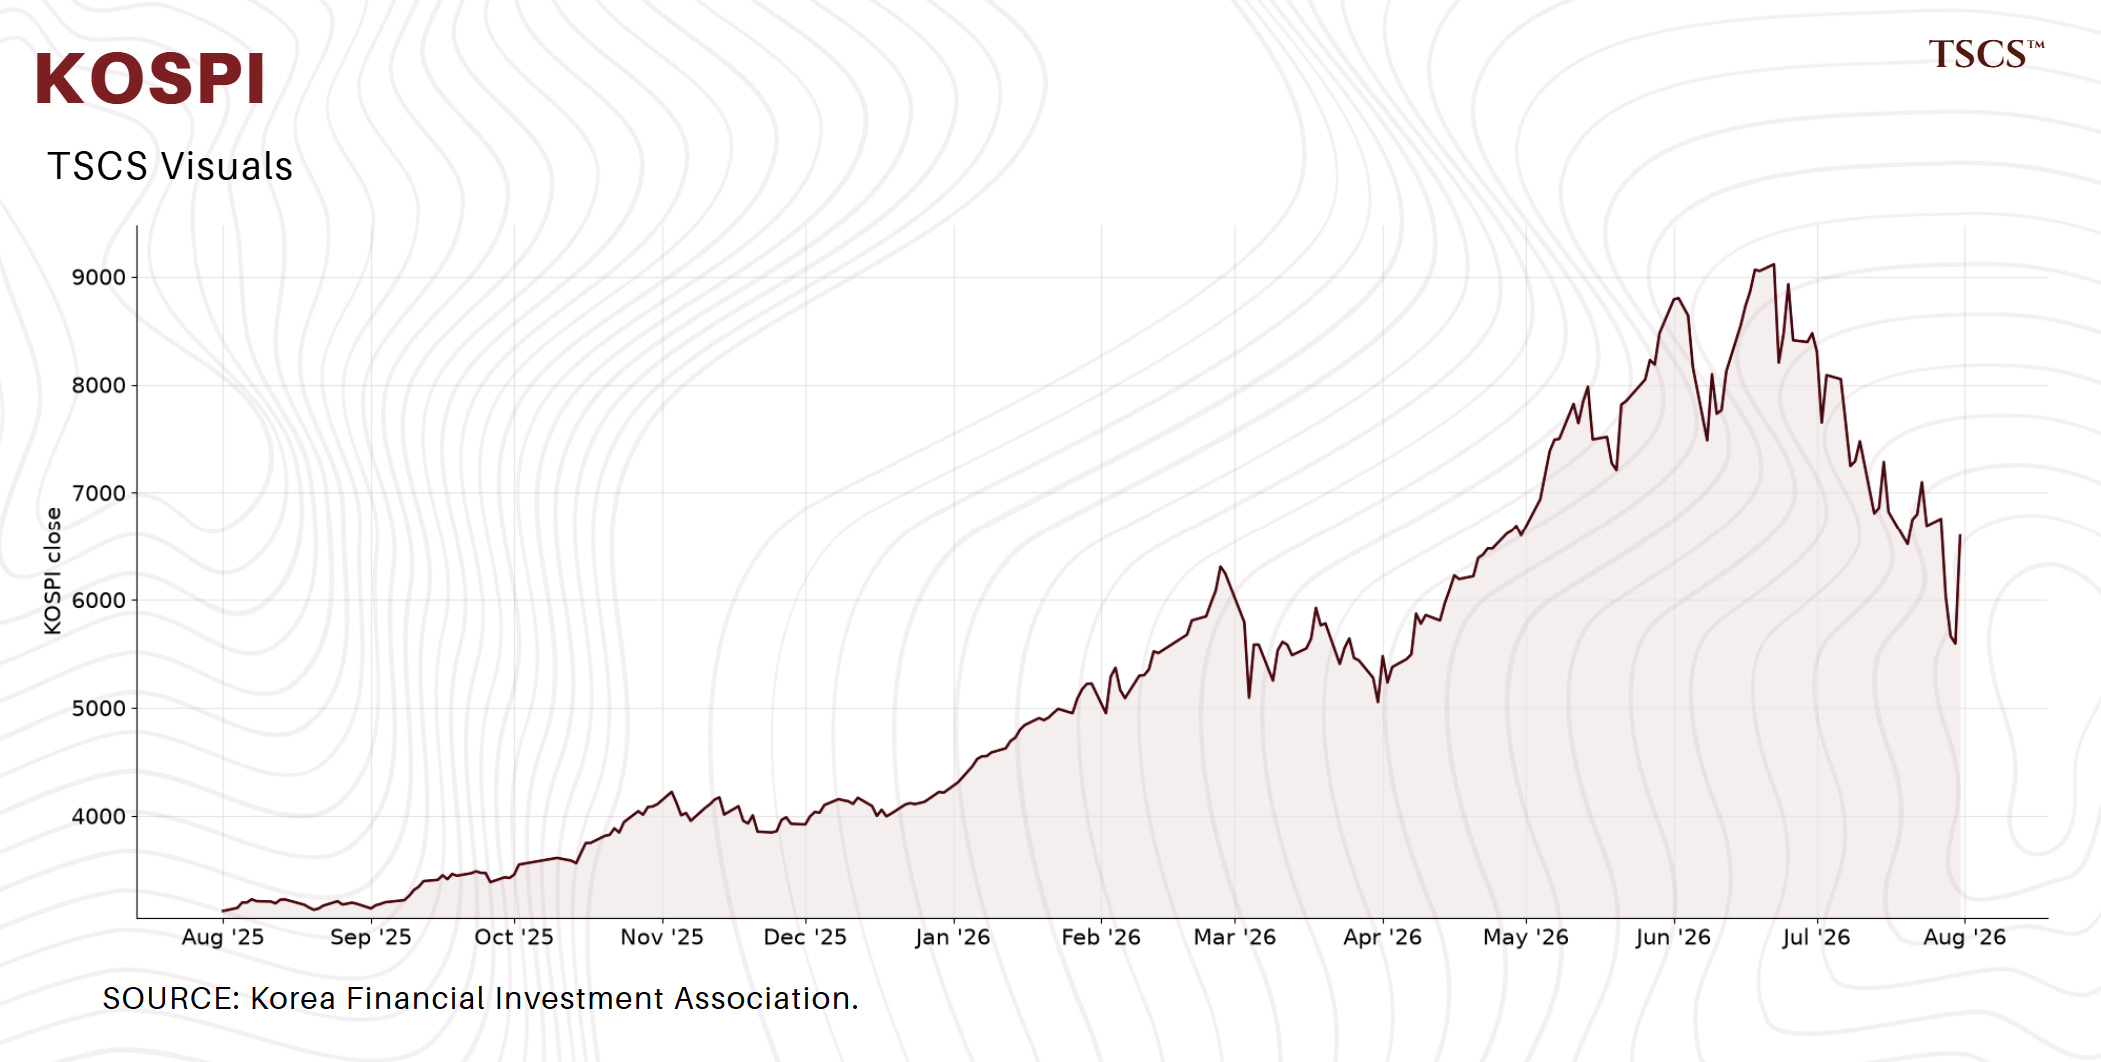
By the 22nd of June the index is at 9,114.55, an all-time high. Your dip-buy worked. The June 8th break gets reclassified, in your head and in everyone’s, as the buying opportunity it turned out to be.
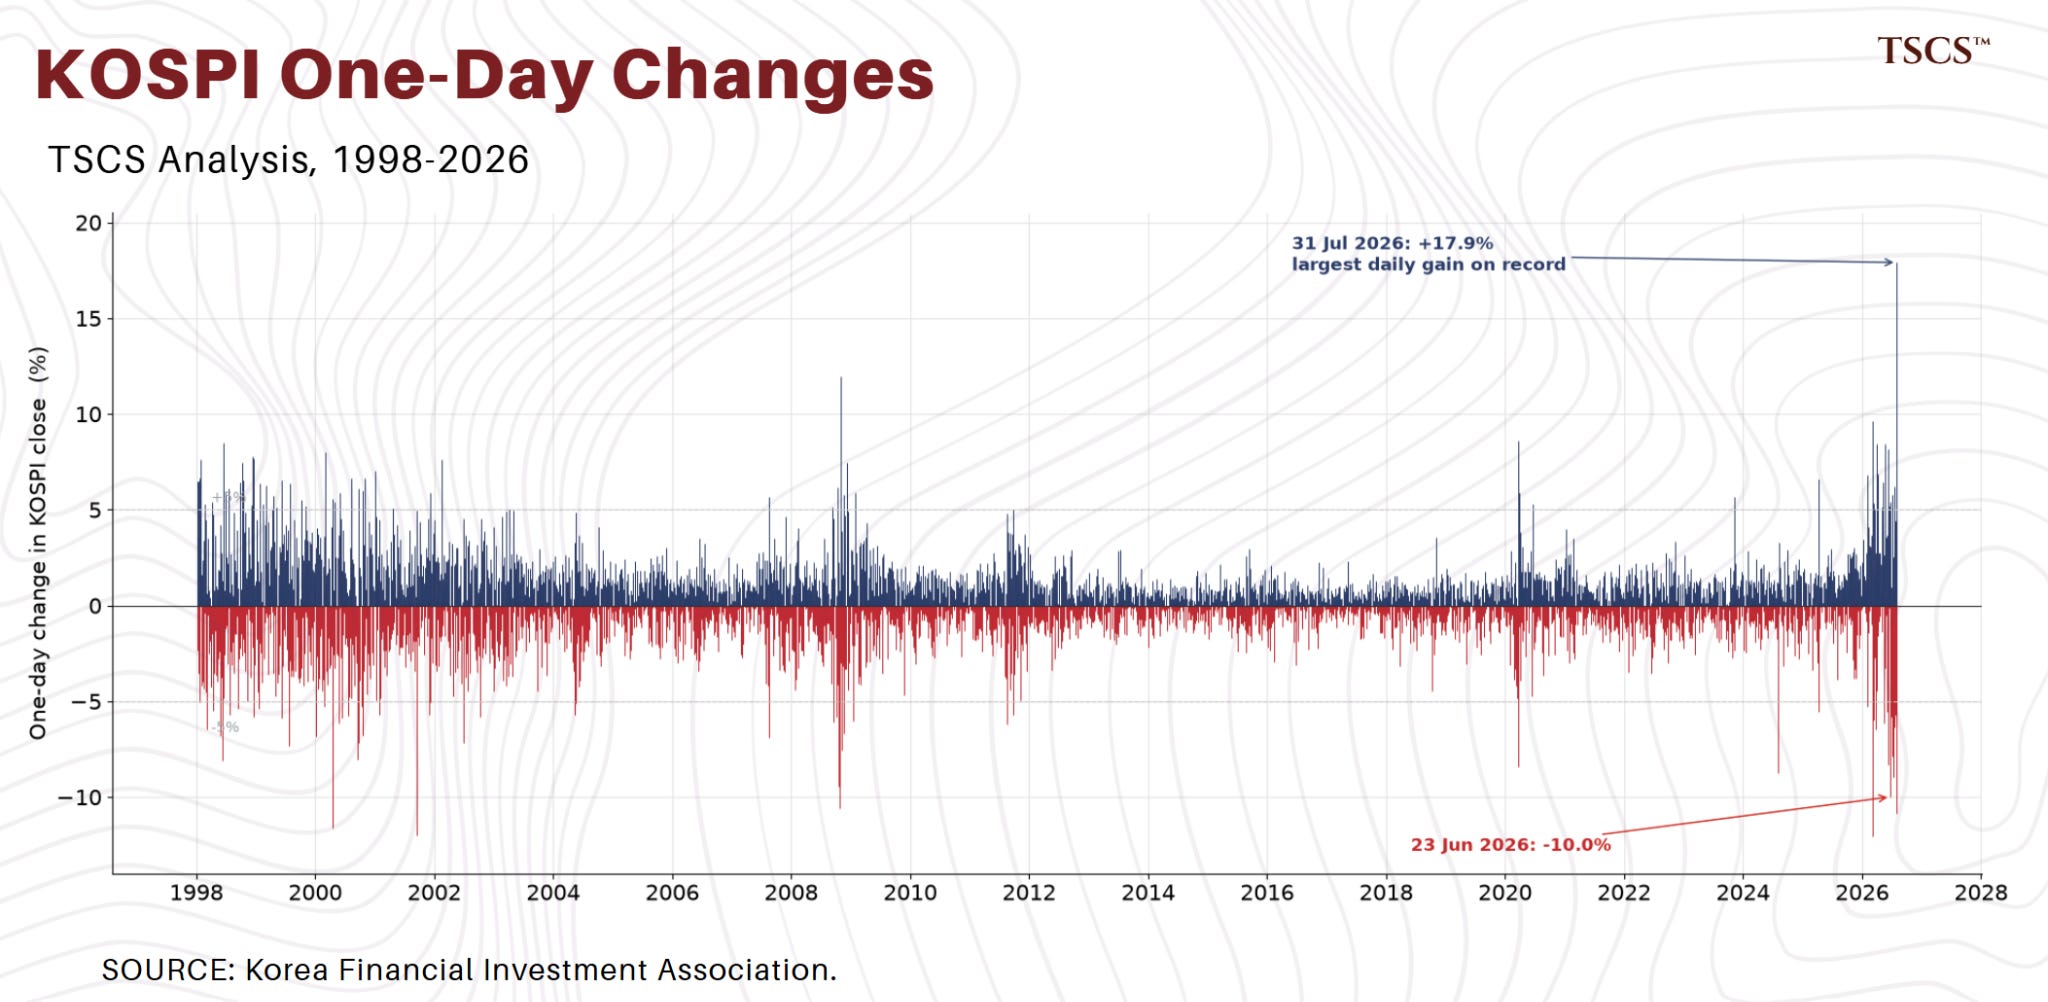
So when the 23rd opens and the index drops 10% in a session, you know what this is.
You’ve seen this movie, it was two weeks ago, and you wire more cash and maybe add to the name that’s suddenly cheap again.
Then July. Another break on the 8th. Then the last week of the month, market-wide circuit breakers on the 28th and the 29th, the first back-to-back halts across both boards in the exchange’s history, and this time there’s no cash left to wire because you’ve been wiring it for five weeks. On the second business day the broker’s waterfall runs, and it takes the position that broke you.
That’s the story of July in one account.
Now here’s the part I actually came to tell you, because when I pulled the data to write the usual version of this piece, the leverage mania, the reckoning, the numbers said the usual version is wrong.
The number everyone quoted, and the one nobody did
The margin debt in that story peaked at ₩38.63 trillion on the 24th of June. Record, in won by a mile, and it’s the number in every write-up (mine included).
Korea also publishes, daily since 1998, the total cash customers hold at brokerages, investor deposits, ₩136.55 trillion on the same day. Divide one by the other and you get 0.283.
That’s not my invention, margin debt over deposits is a gauge the Bank of Korea itself has used to read speculative heat in this market.
0.283 is the 45.9th percentile of 28 years of daily readings. Against everything since 2005, the 27.6th.
Below average. At the all-time high.
2008 arrived with the ratio around 0.46. 2011, around 0.41. The all-time high, 0.48, printed in October 2018. Even COVID hit with the gauge at 0.35.
Since margin lending became a real feature of this market, every break has arrived with the gauge elevated. This one is the anomaly, a record crash that arrived with the gauge reading below its 20-year average.
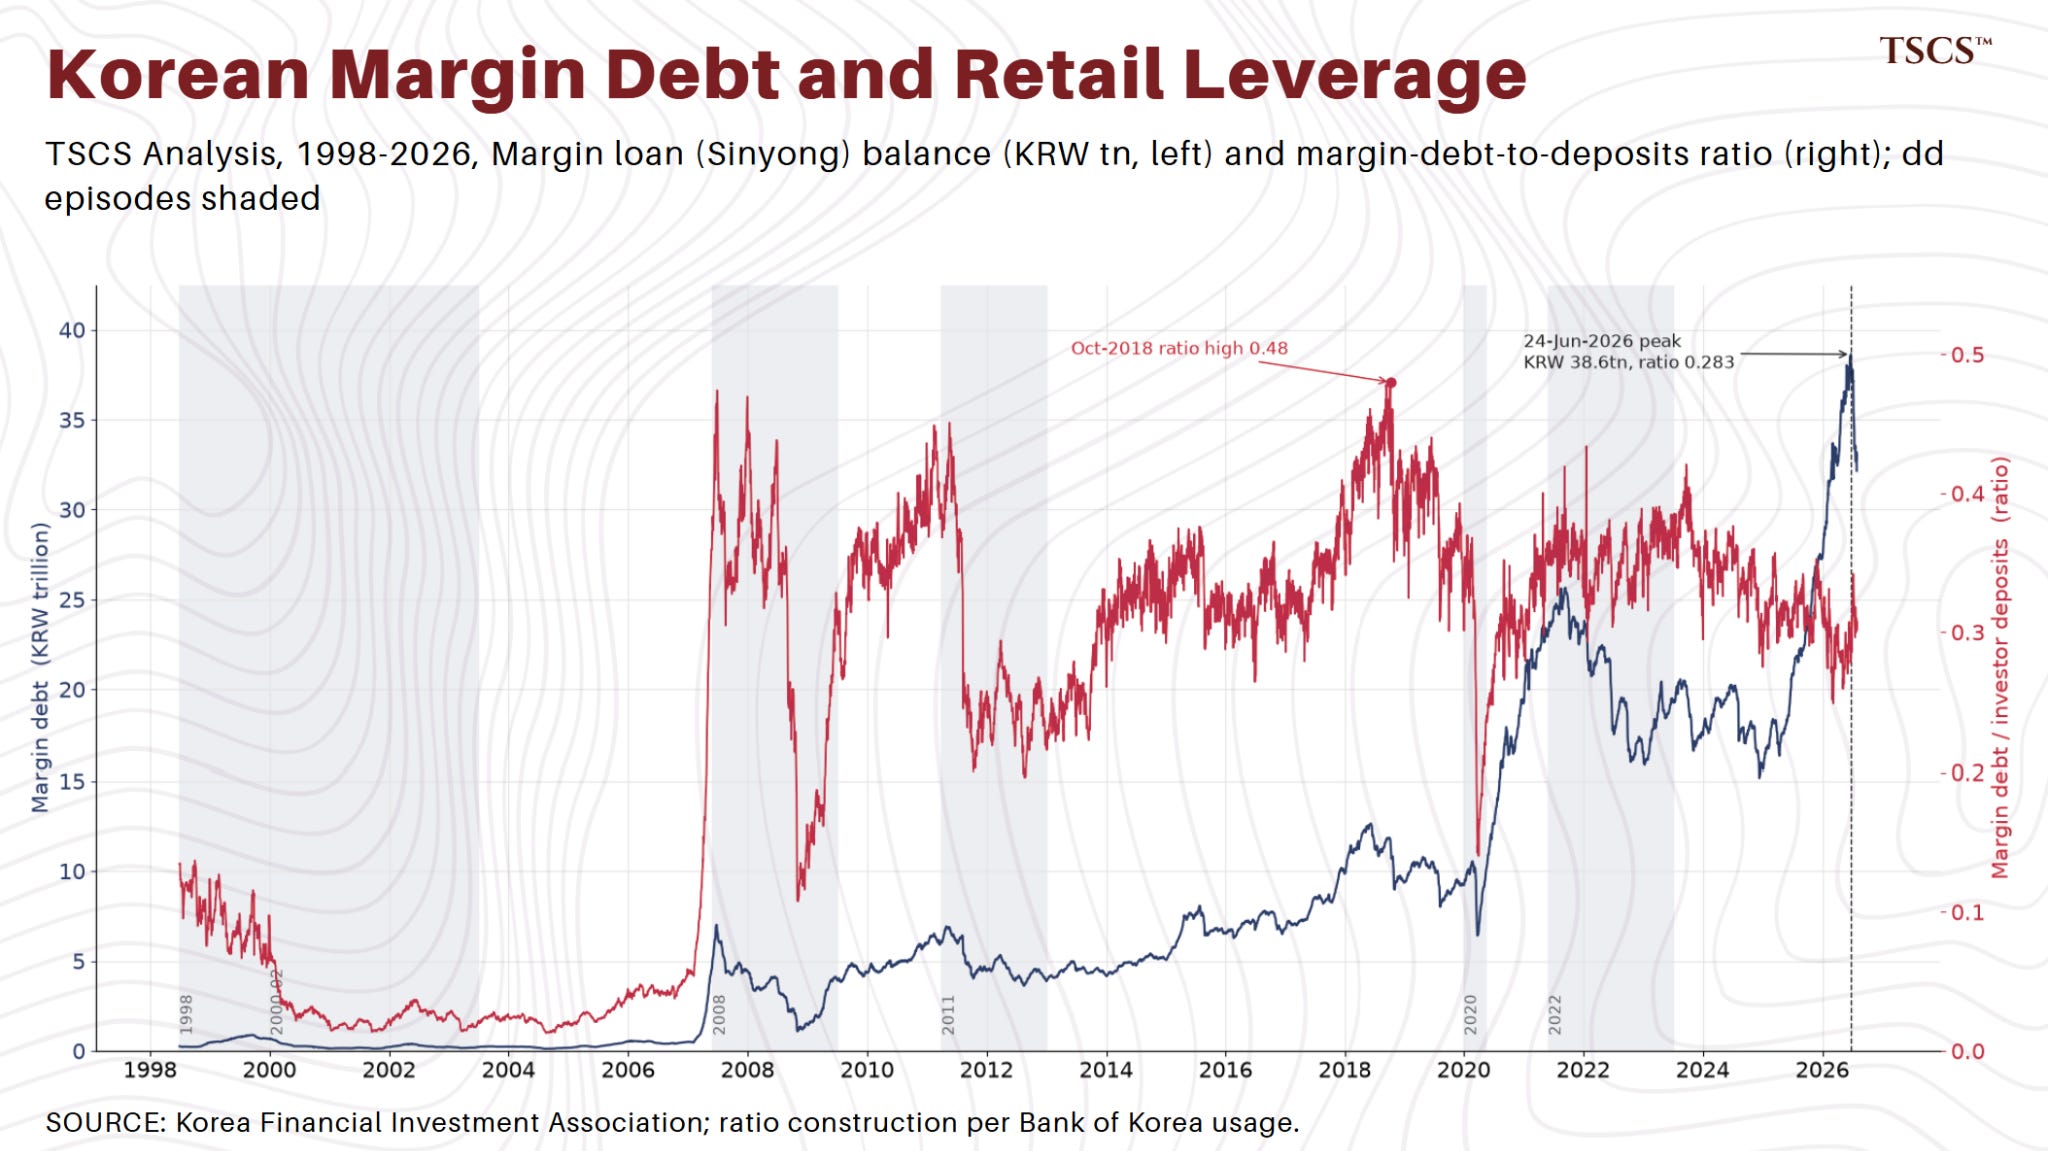
The ratio is a heat gauge, the way the BOK uses it, and nothing more. As a heat gauge, it read cool.
The sharpest objection I’ve seen is that the denominator was itself swollen. Record cash poured into these accounts through 2025 and 2026, so a low ratio could just mean both sides of the mania grew together.
Fair, so what does it concede? The borrowing kept pace with the cash instead of outrunning it. 2007 and 2018 were credit-funded manias, the debt grew faster than money.
This one was cash-funded. Credit-funded positions can be ended by a lender’s decision and cash-funded ones end one account at a time, which is half the argument of this piece.
So the mania story fails on its own gauge. Which means something else has to explain what happened…
You’ve already read my candidate. Not the size of the debt, its address: 1/3 or so of all margin credit sitting on 2 names, ₩11.9 trillion of embedded 2x leverage stacked on the same 2 names in products 7 weeks old, and broker waterfalls that, when the shortfall came, sold the shortfall-causing position first, into the same opening auctions, on the same mornings.
Statistics aren’t measuring what you think
Here’s something I got wrong earlier, where the correction turned out to be more interesting.
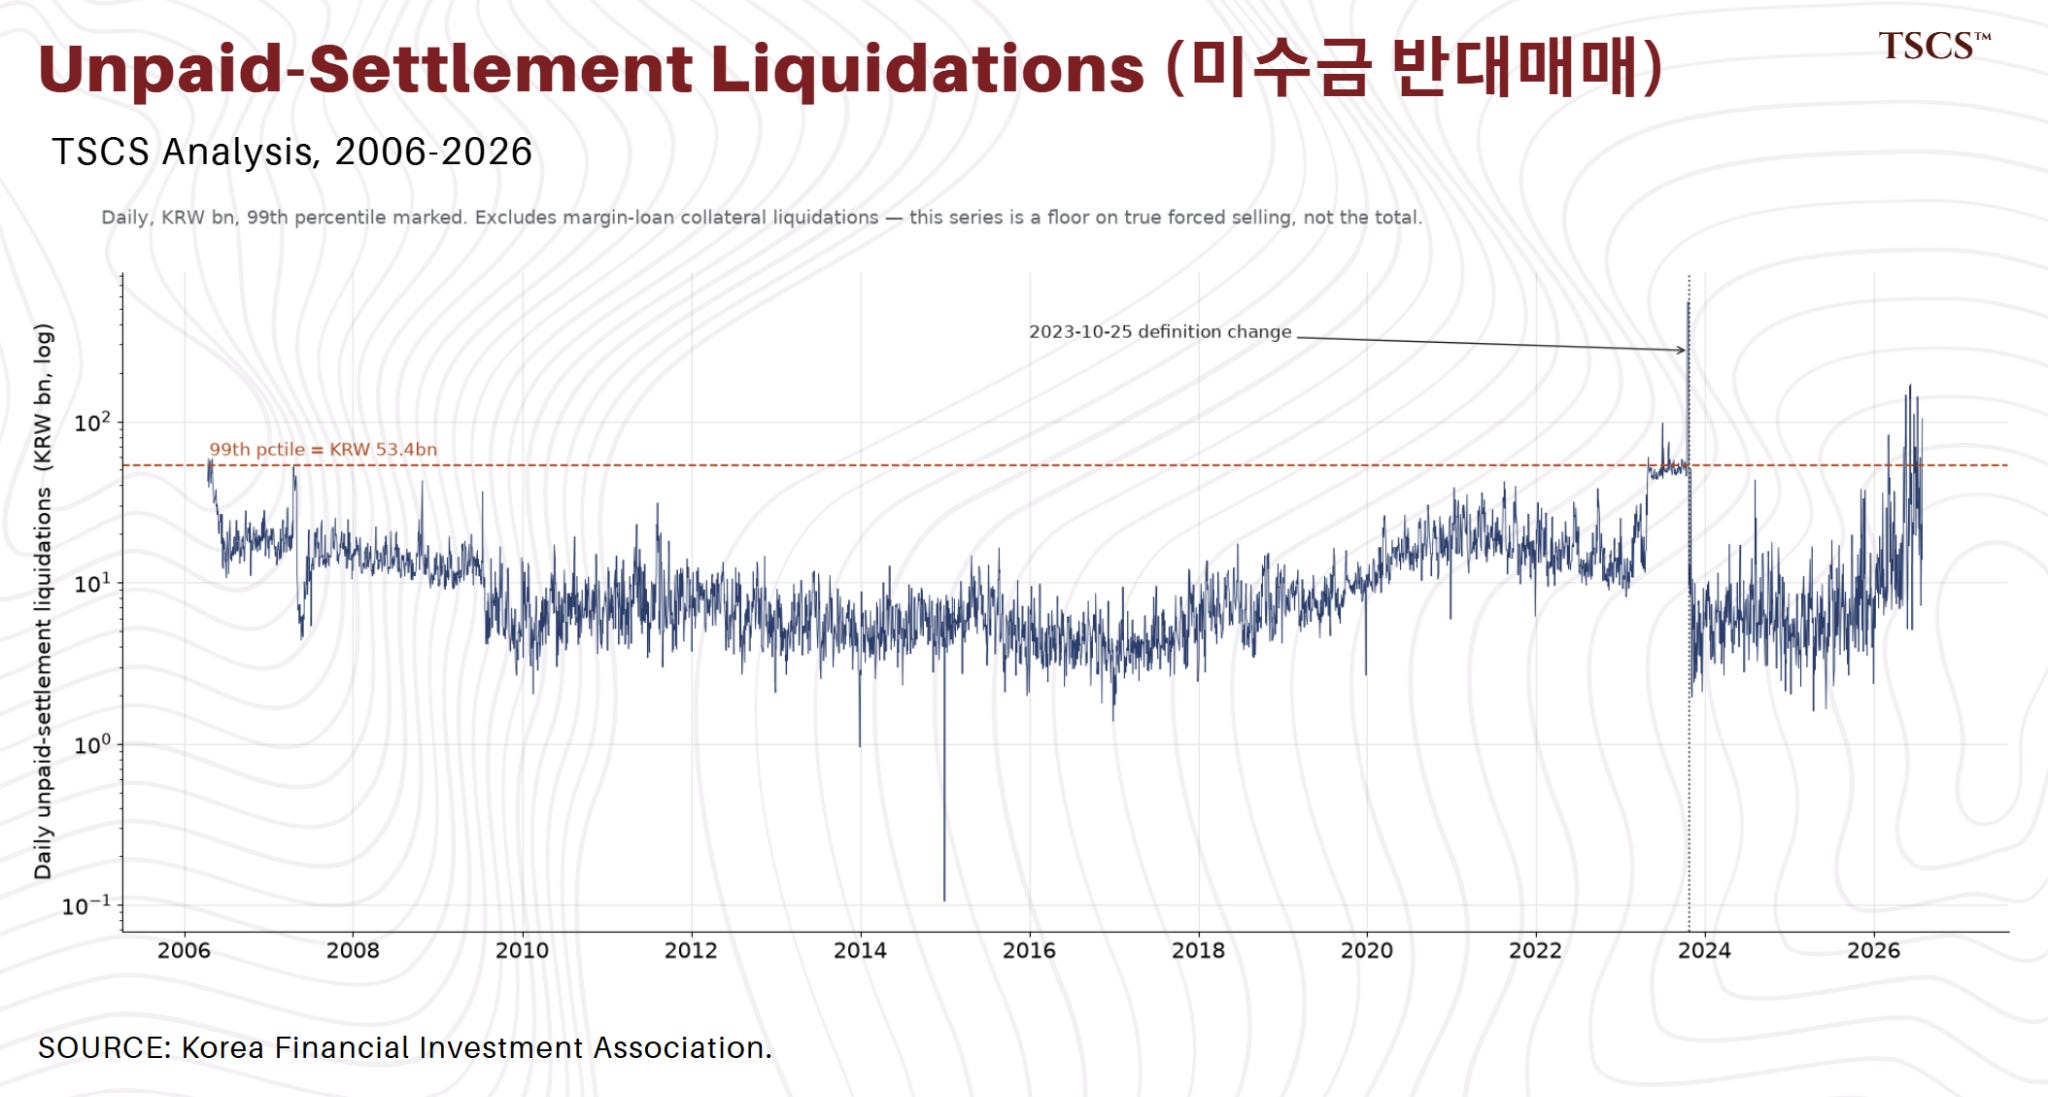
Korea publishes a daily forced-liquidation number, and it went vertical at every break: ₩169.8 billion on the 9th of June, ₩110.8 billion on the 24th, ₩142.2 billion on the 9th of July, ₩103.8 billion on the 30th. All of those sit above the 99th percentile of the 20-year series. I originally read that series as the margin-call machine at work.
It isn’t. Read KOFIA’s own definition and the series counts liquidations of unpaid settlement balances, 미수금, the T+2 trades people couldn’t pay for. It excludes margin-loan collateral liquidations entirely.
The number Korea quotes as “forced selling,” the one in every wire story including the ones I cited, does not contain the forced selling from margin accounts at all.
The liquidations in the story above, the waterfall running through collateral, are not in it. The published statistic is a floor, and the true forced-selling total in June and July was larger than anything officially printed, by an amount nobody outside the brokers can currently measure.
So the statement of the evidence is this. The visible slice of forced selling printed top-1% readings at all four breaks. The larger slice is unmeasured. And the aggregate leverage gauge read cool the whole time. Its own statistics understated the selling while it happened.
What the cash did
From the 24th of June to the 30th of July, margin debt fell ₩6.48 trillion, to ₩32.15 trillion. Investor deposits fell ₩31.89 trillion, to ₩104.66.
System-wide, five won of cash leaving for every one won of debt retired.
Where did it go? Margin calls ate some. Some settled outright purchases, retail were heavy net buyers through the fall. Some left for yield, the BOK hiked to 2.75% mid-month and cash walking out of brokerage deposits in a hiking cycle is ordinary. Some of it is settlement and IPO plumbing.
The cash buffer across the whole system is 23% smaller than five weeks ago, and whatever deleveraging remains happens against a thinner buffer at higher rates.
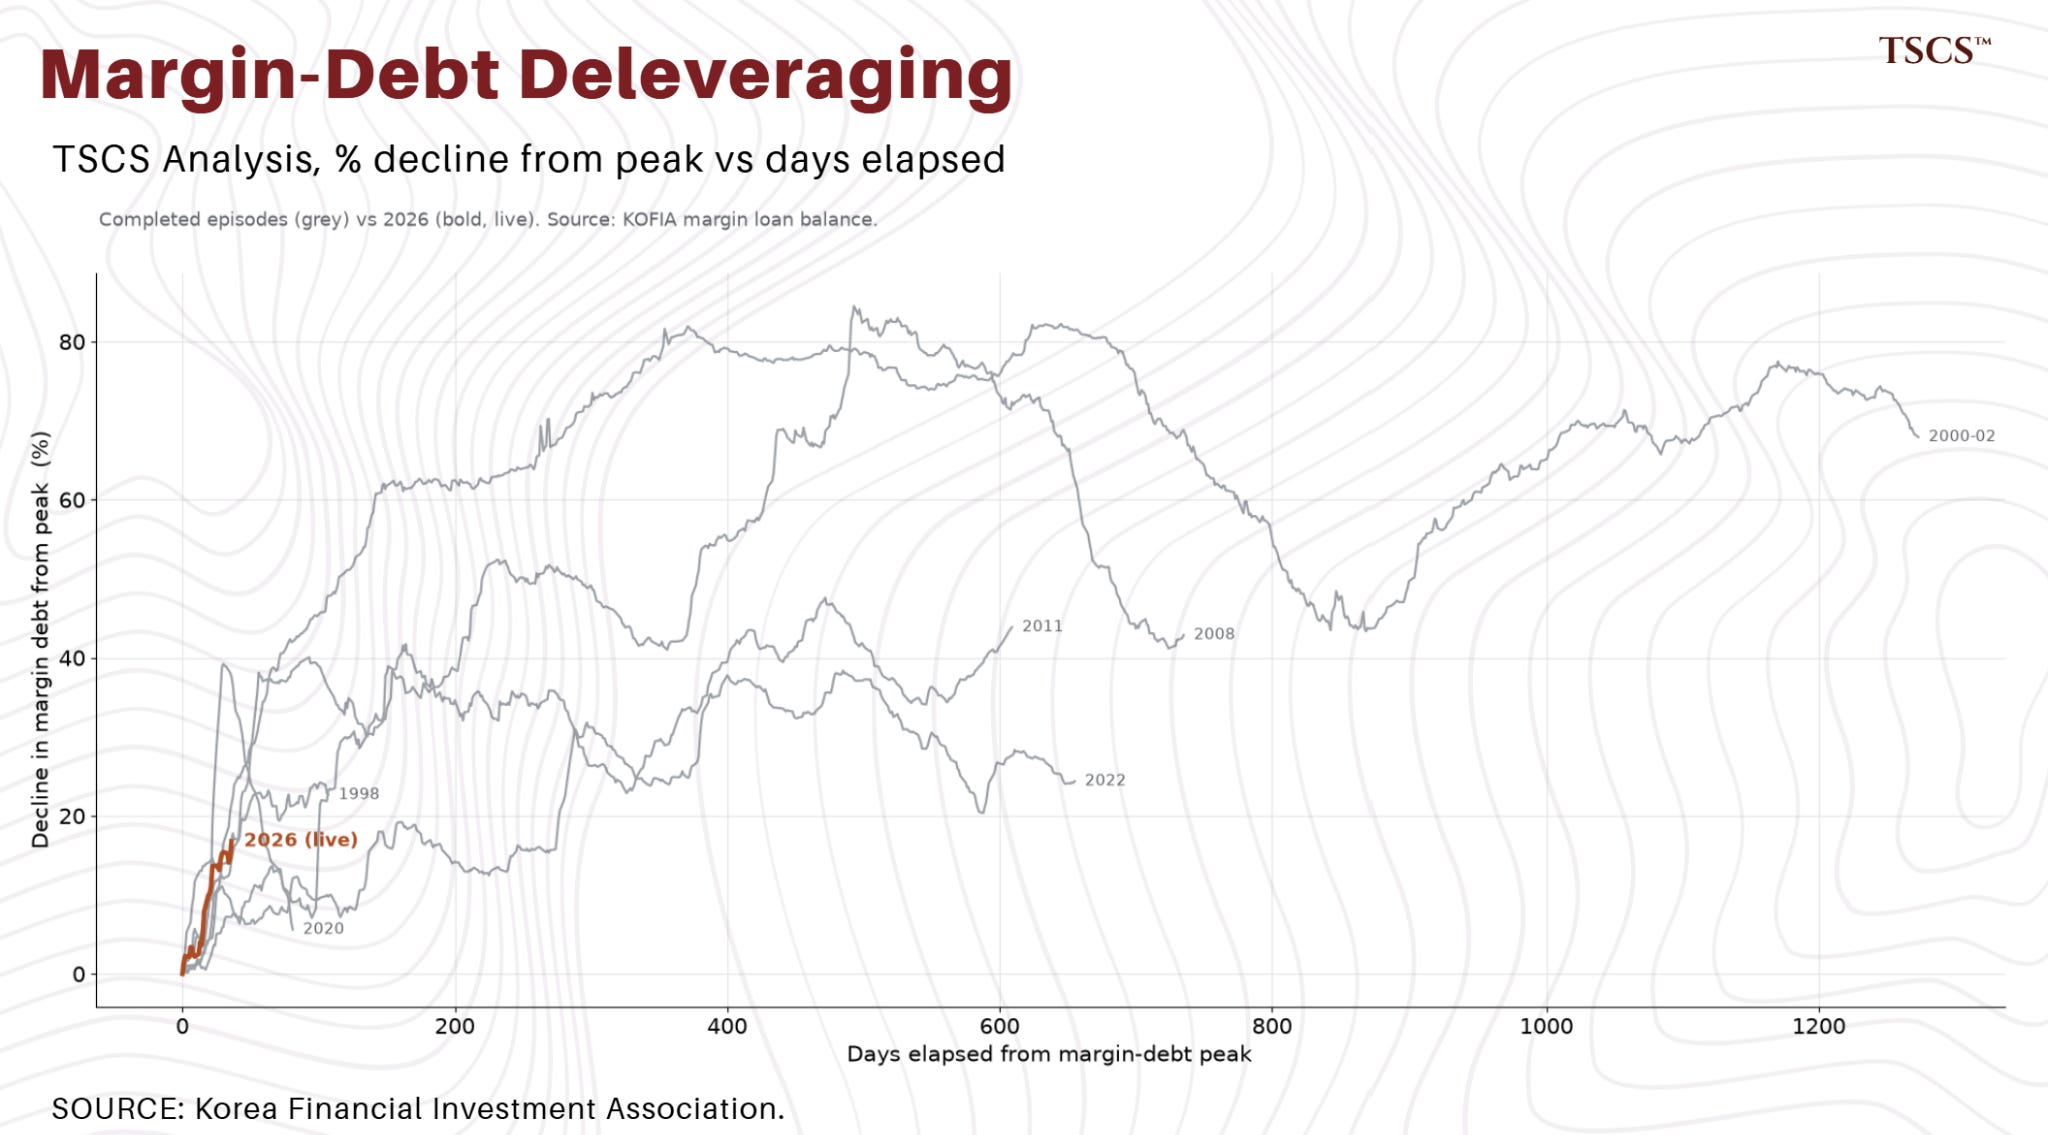
For scale, every completed margin deleveraging in the Korean record: 82% off the peak in 2000-02, 85% in 2008, 48% in 2011, 39% in 2020, 38% in 2022. The fastest took 30 days, the slowest 645. We’re 36 days in and down 16.8%. Either this one is something the record hasn’t seen, or it’s early.
The full episode table and method are later, so you can pull the definitions apart yourself.
The margin call with someone on the other side of the phone
Citrini wrote a thread on Thursday that’s definitely worth your time, imagining you’re an LP in Situational Awareness.
His argument was that people who invested because they believed the AI thesis at full volume don’t turn bearish because the fund drew down, so the LPs would fund Leopold’s raise, buy the dip, and the forced seller would mark the bottom rather than cause the next leg.
Half right.
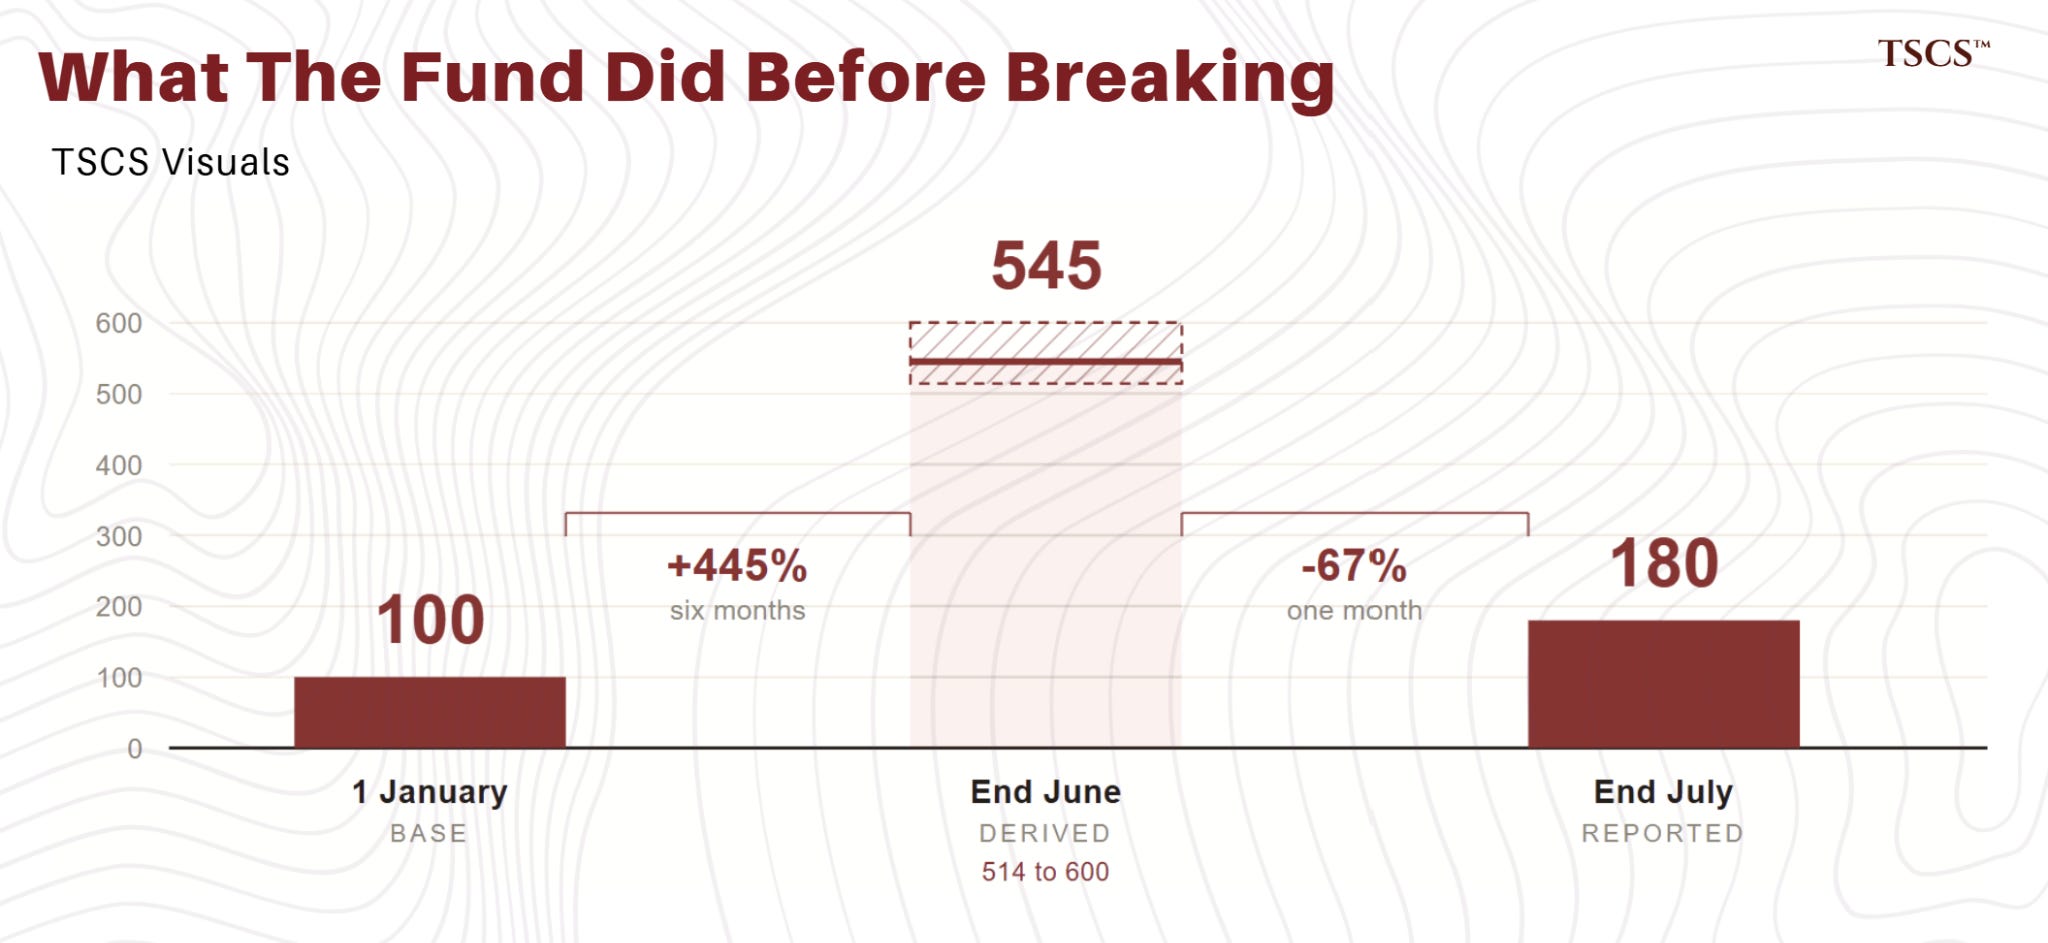
The dip got bought. Just not by the LPs. Per the WSJ, the fund was down about 67% in July, still up about 80% on the year, and racing to cover margin calls from its lenders.
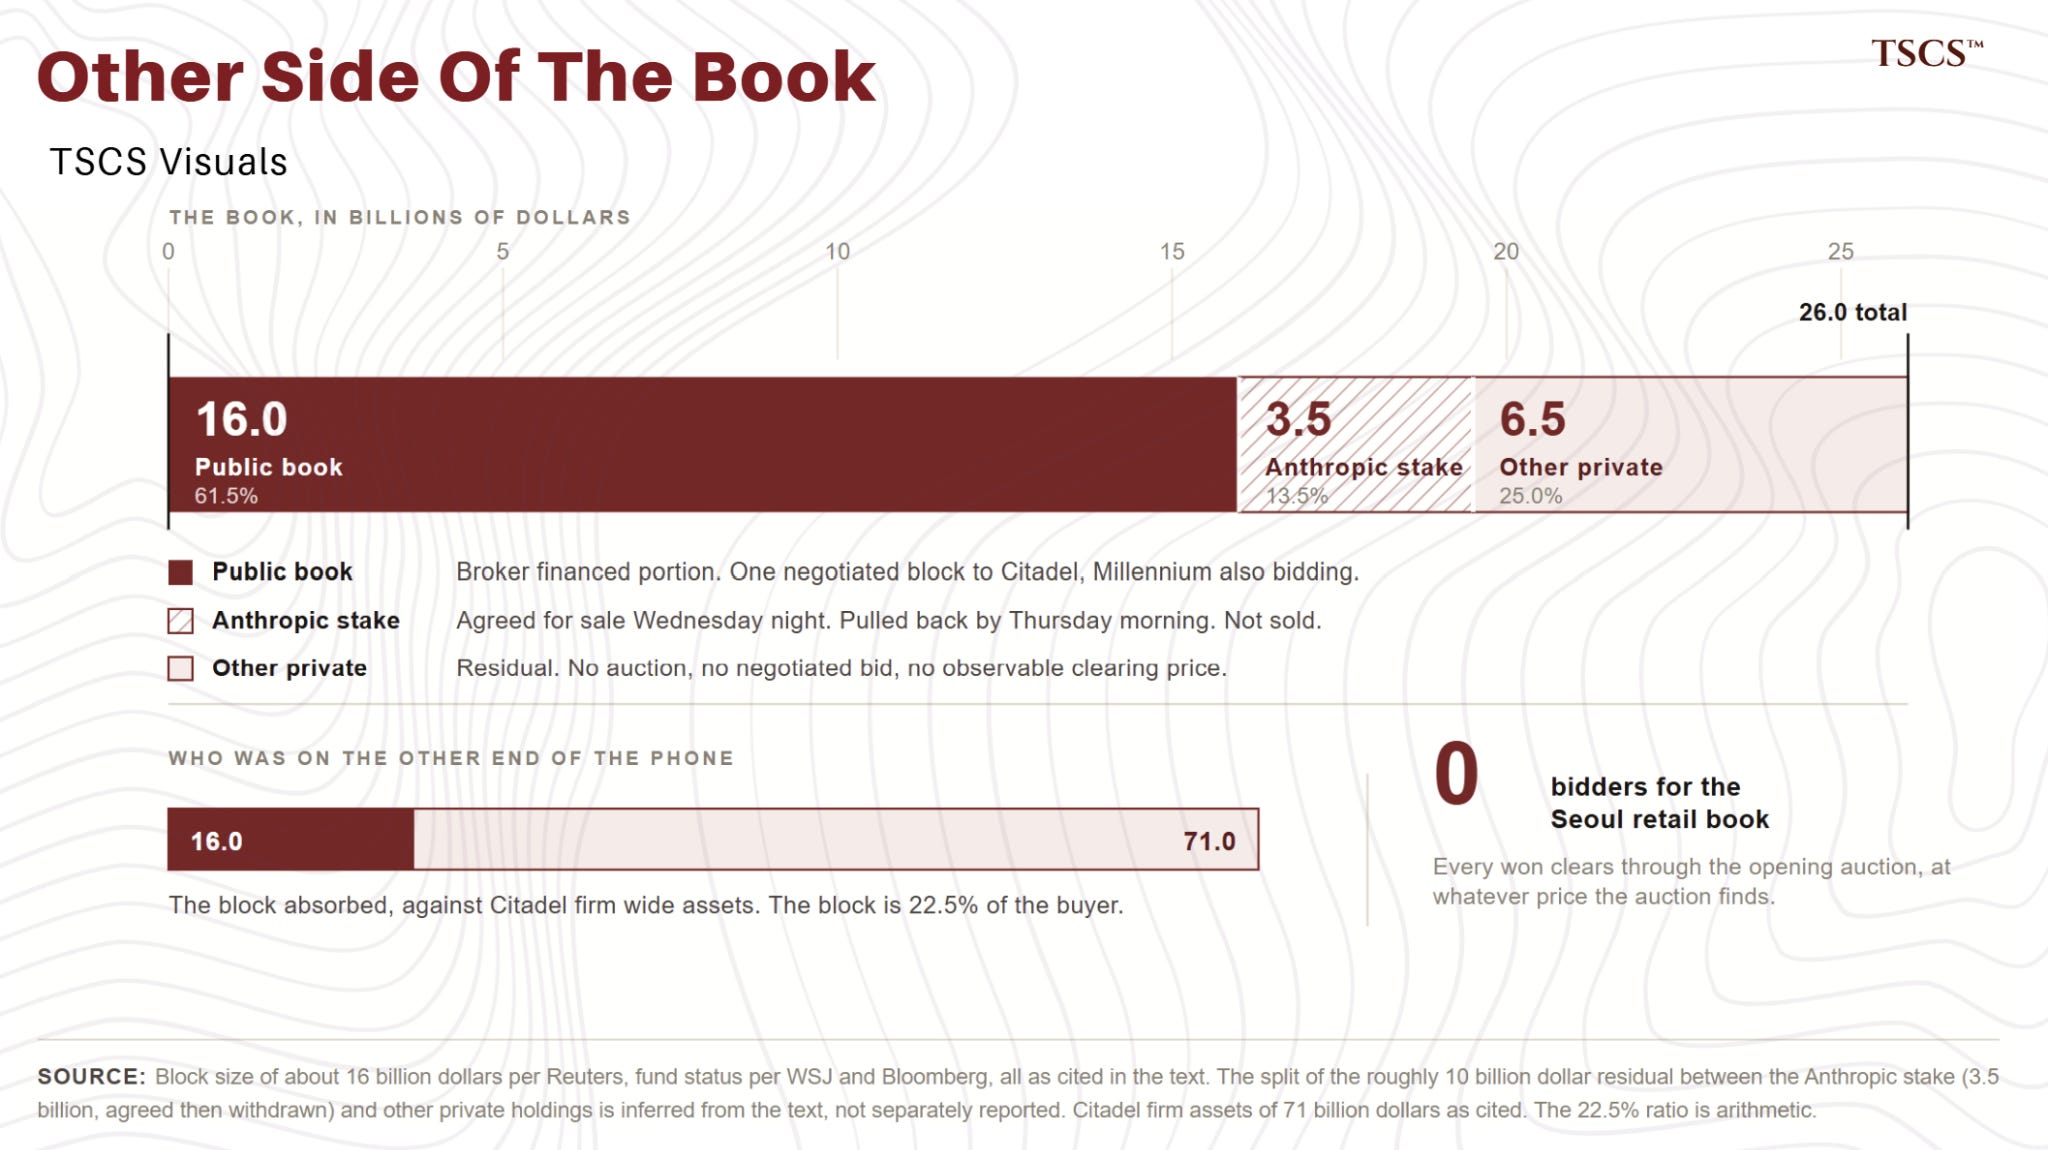
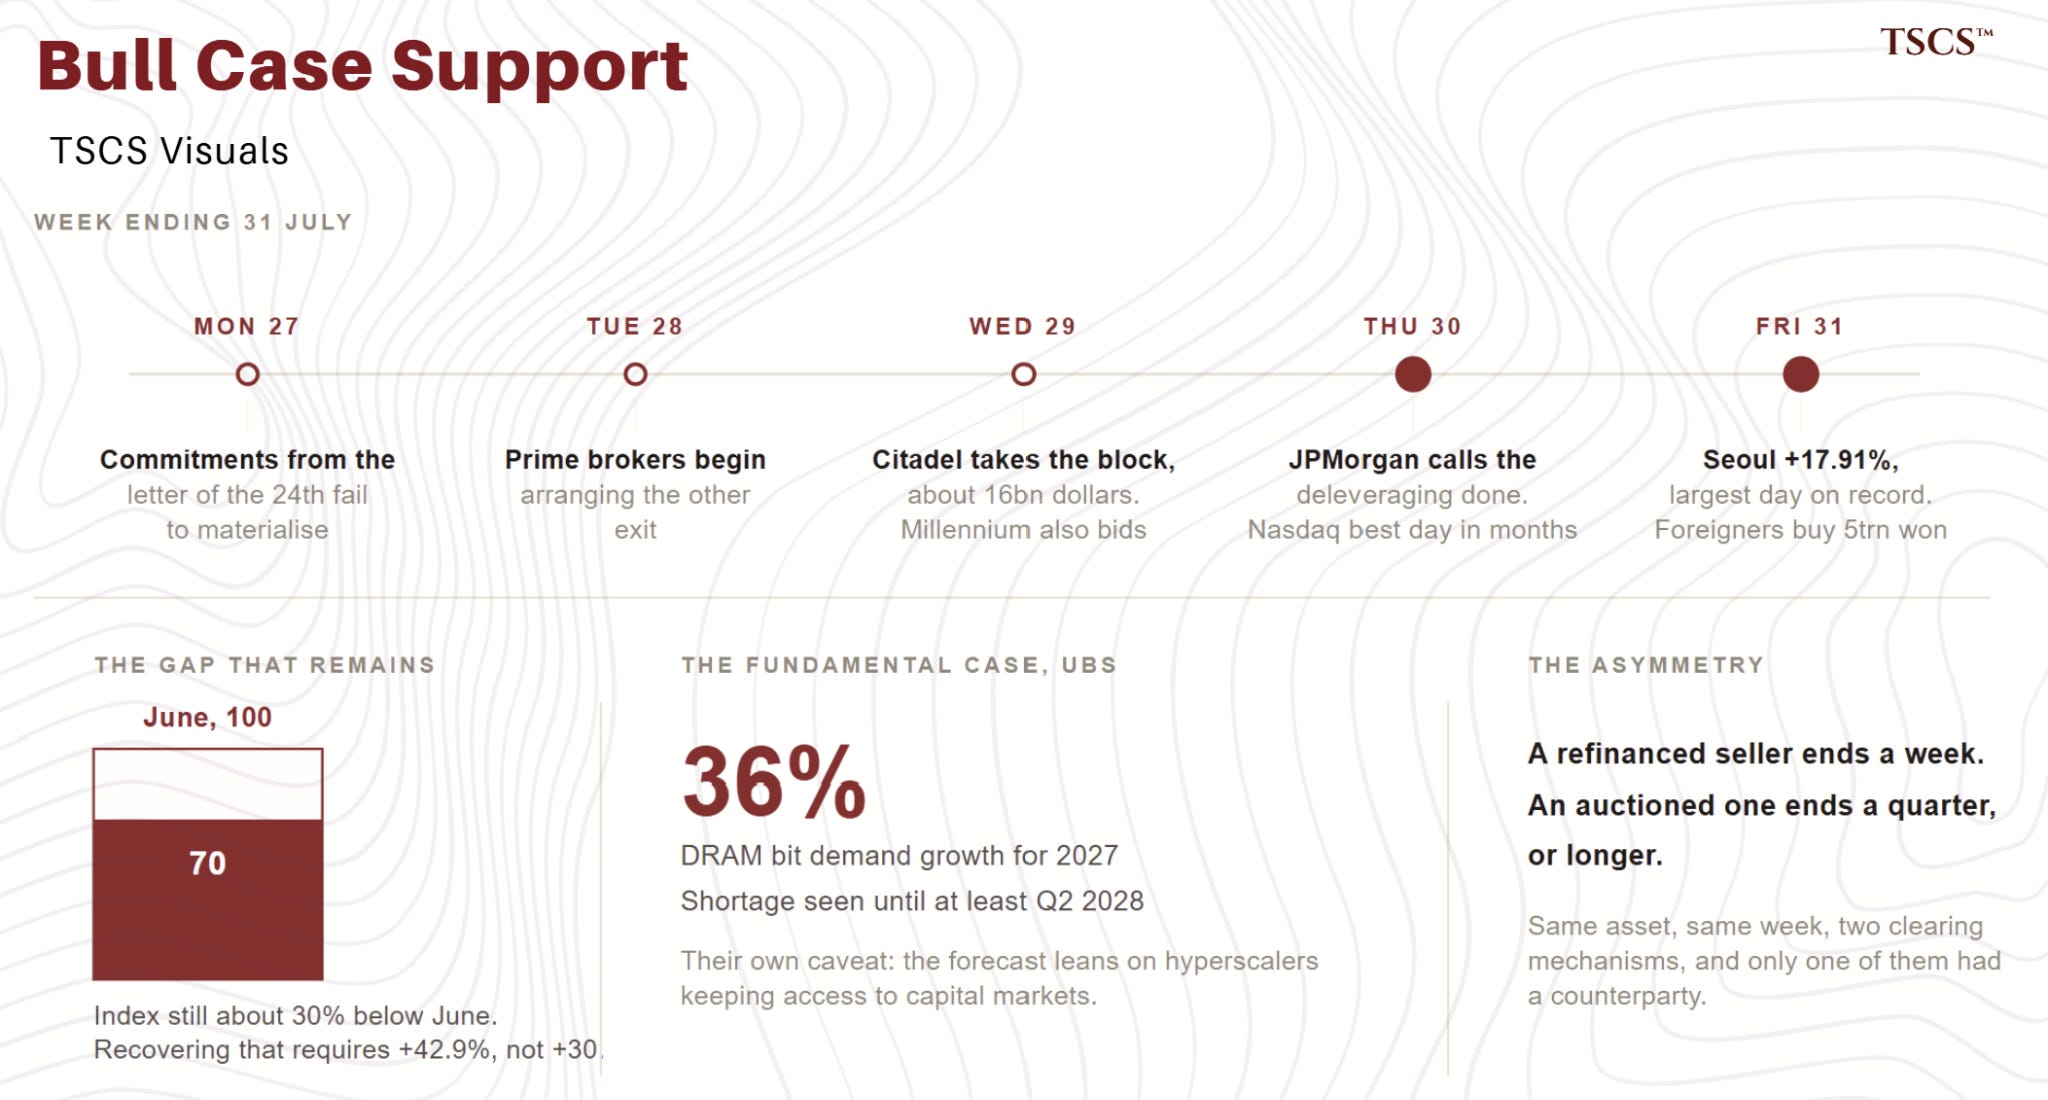
The letter of the 24th invited fresh capital from August 1st; per Bloomberg’s reporting the commitments didn’t materialise. By Wednesday the prime brokers had arranged the other exit, Citadel taking the bulk of a public book Reuters put around $16 billion in one negotiated block, the broker-financed portion specifically, with Millennium bidding too.
What’s left is about $10 billion, mostly private, including the Anthropic stake he reportedly agreed to sell $3.5 billion of on Wednesday night and pulled back from by Thursday morning. By midweek JPMorgan was telling clients the institutional deleveraging in tech, chips and memory looked done, faster than expected. Thursday the Nasdaq had its best day in months. Friday Seoul rose 17.91%, the largest day in the index’s history.
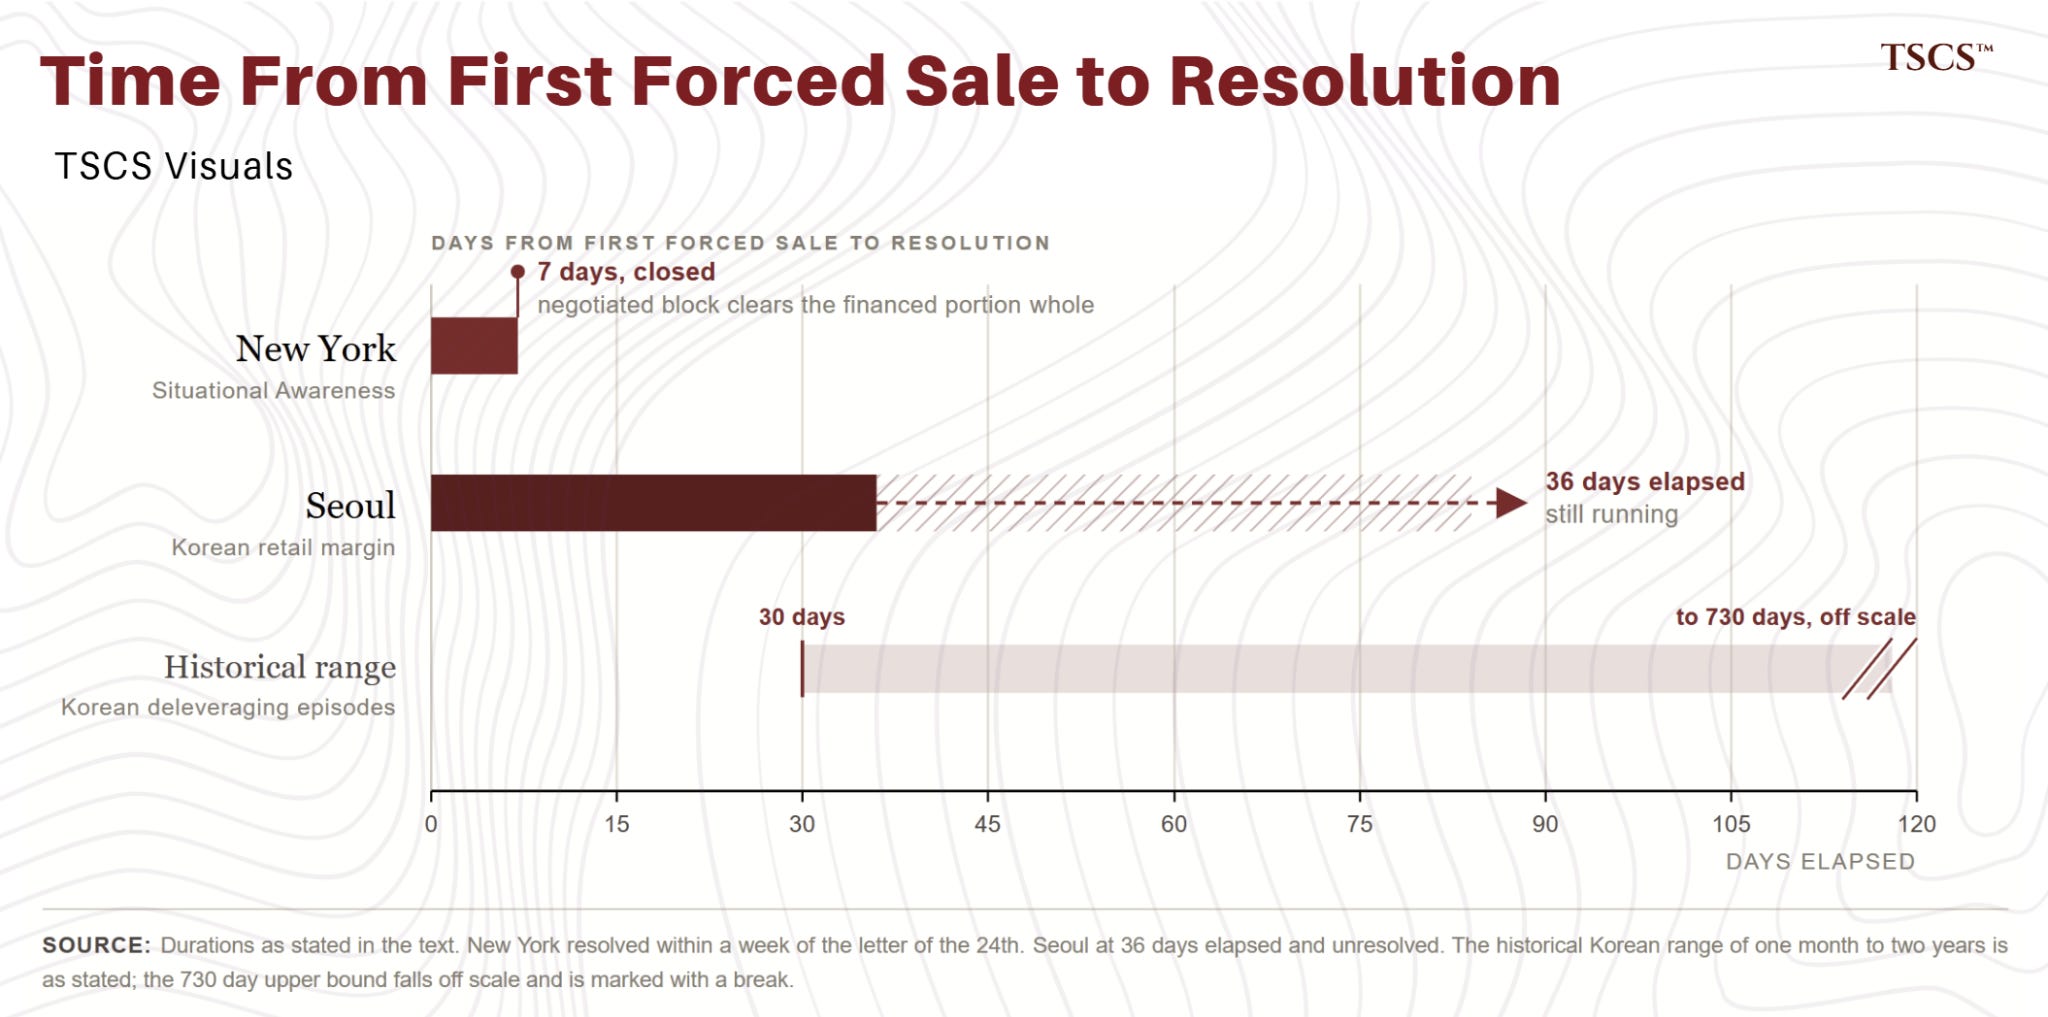
That’s what a margin call looks like when the seller can be refinanced or bought out whole. Brutal for a week, then finished.
When the raise fails there’s still a phone, and on the other end is a $71 billion fund that would rather own the book than watch it liquidate.
Who buys that book? There’s no consortium for a liquidated retail account, no negotiated block, no bid for the financed portion. Every won clears through the opening auction at whatever the auction finds, which is why the New York margin call finished inside a week and the Seoul one is 36 days into something that has historically taken between a month and two years.
Where I might be wrong
The aggressive case is coherent and this week fed it. If the institutional clear-out was the binding constraint, it’s gone, and the fundamentals improved while it cleared: Microsoft and Amazon validated the capex, UBS took DRAM bit-demand growth to 36% for 2027 and sees shortage until at least Q2 2028, with the honest caveat in their own work that the whole forecast leans on hyperscalers keeping access to capital markets.
Hynix and Samsung both printed records. Foreigners bought over ₩5 trillion of Korean stock in Friday’s first hour. The index is still around 30% below June after the worst month since 1997. On that reading July was a financing accident that cleared at a discount, and this piece is a careful description of a bottom that already happened.
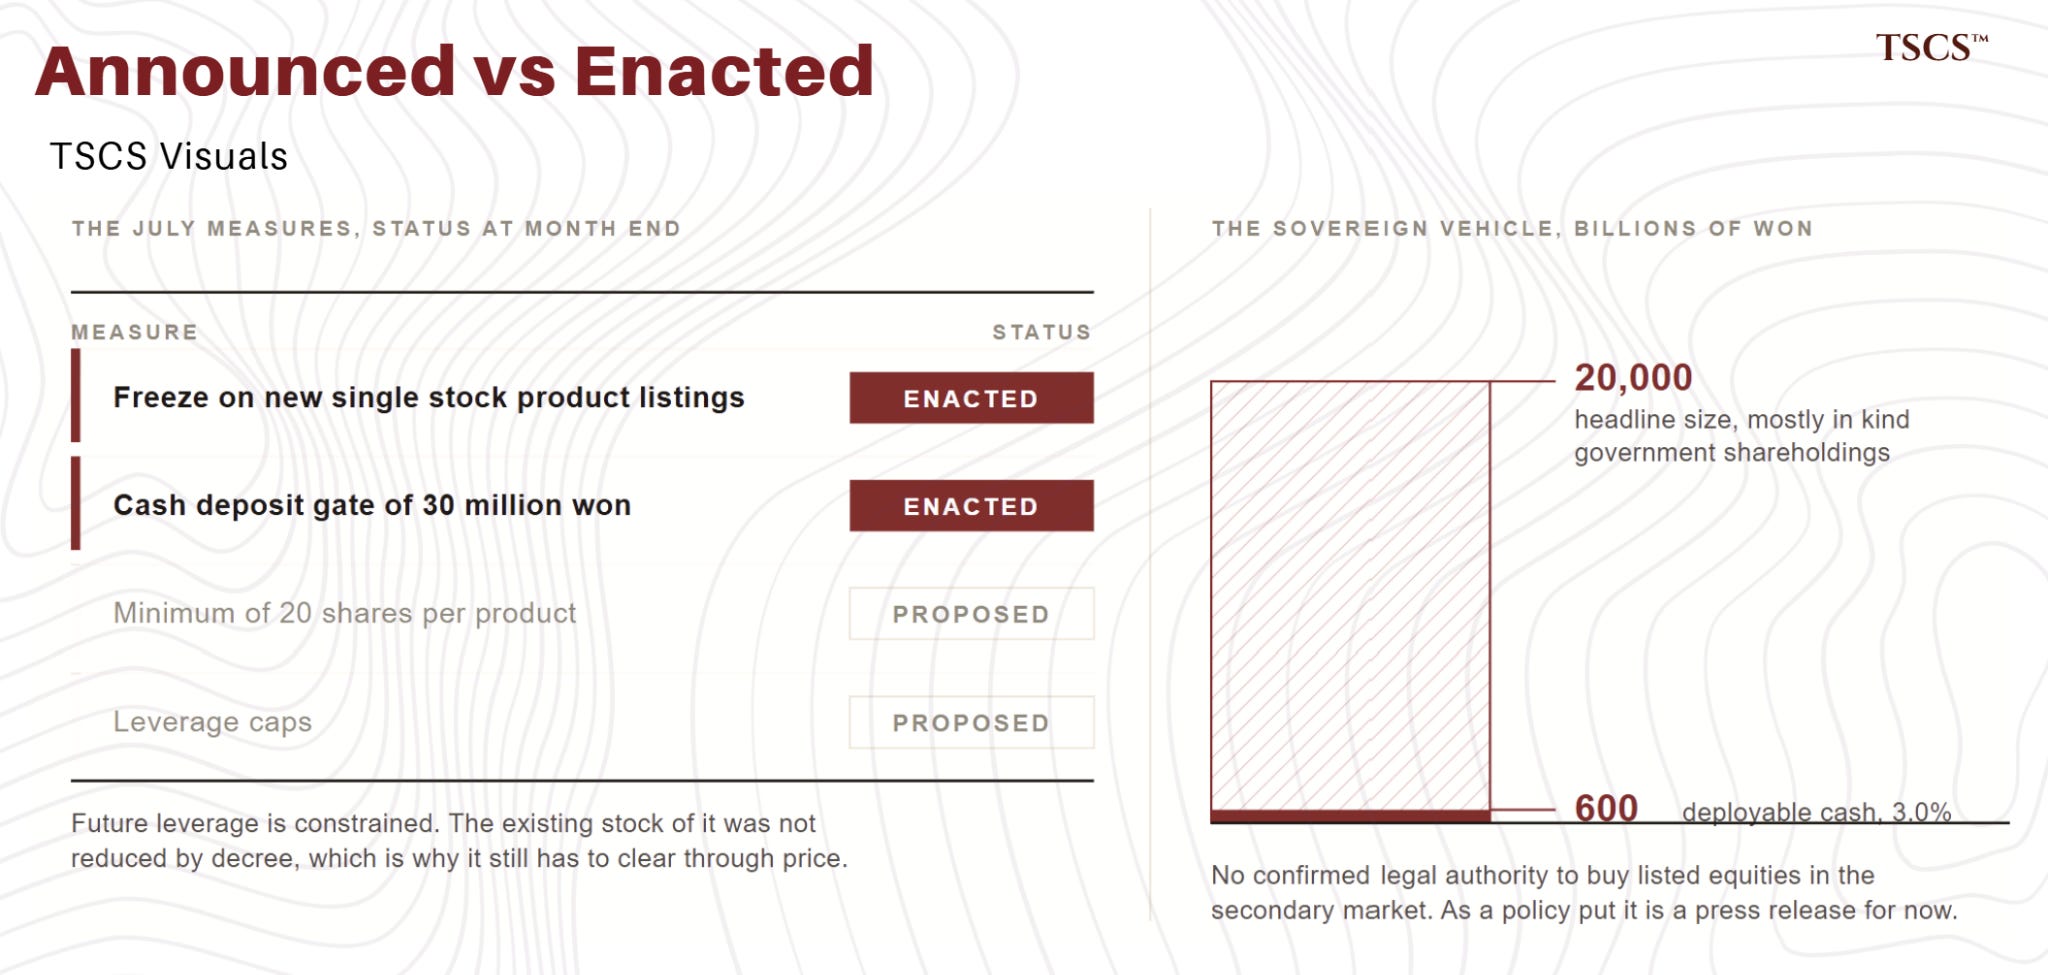
Two things I’d have leaned on a week ago and now won’t. The new sovereign vehicle announced Friday carries a ₩20 trillion headline, but it’s mostly in-kind government shareholdings with roughly ₩600 billion of deployable cash and no confirmed legal authority yet to buy listed equities in the secondary market, so as a policy put it’s a press release for now.
And the July crackdown, read closely, enacted exactly two things by month-end, a freeze on new single-stock product listings and a ₩30 million cash deposit gate. The 20-share minimum and the caps you’ve read about were announcements and proposals. The heads of the FSC and FSS did apologise before the National Assembly on the 29th, per Korean press reports, for failing to meet public expectations. Future leverage is genuinely constrained. The current stock of it was not reduced by decree.
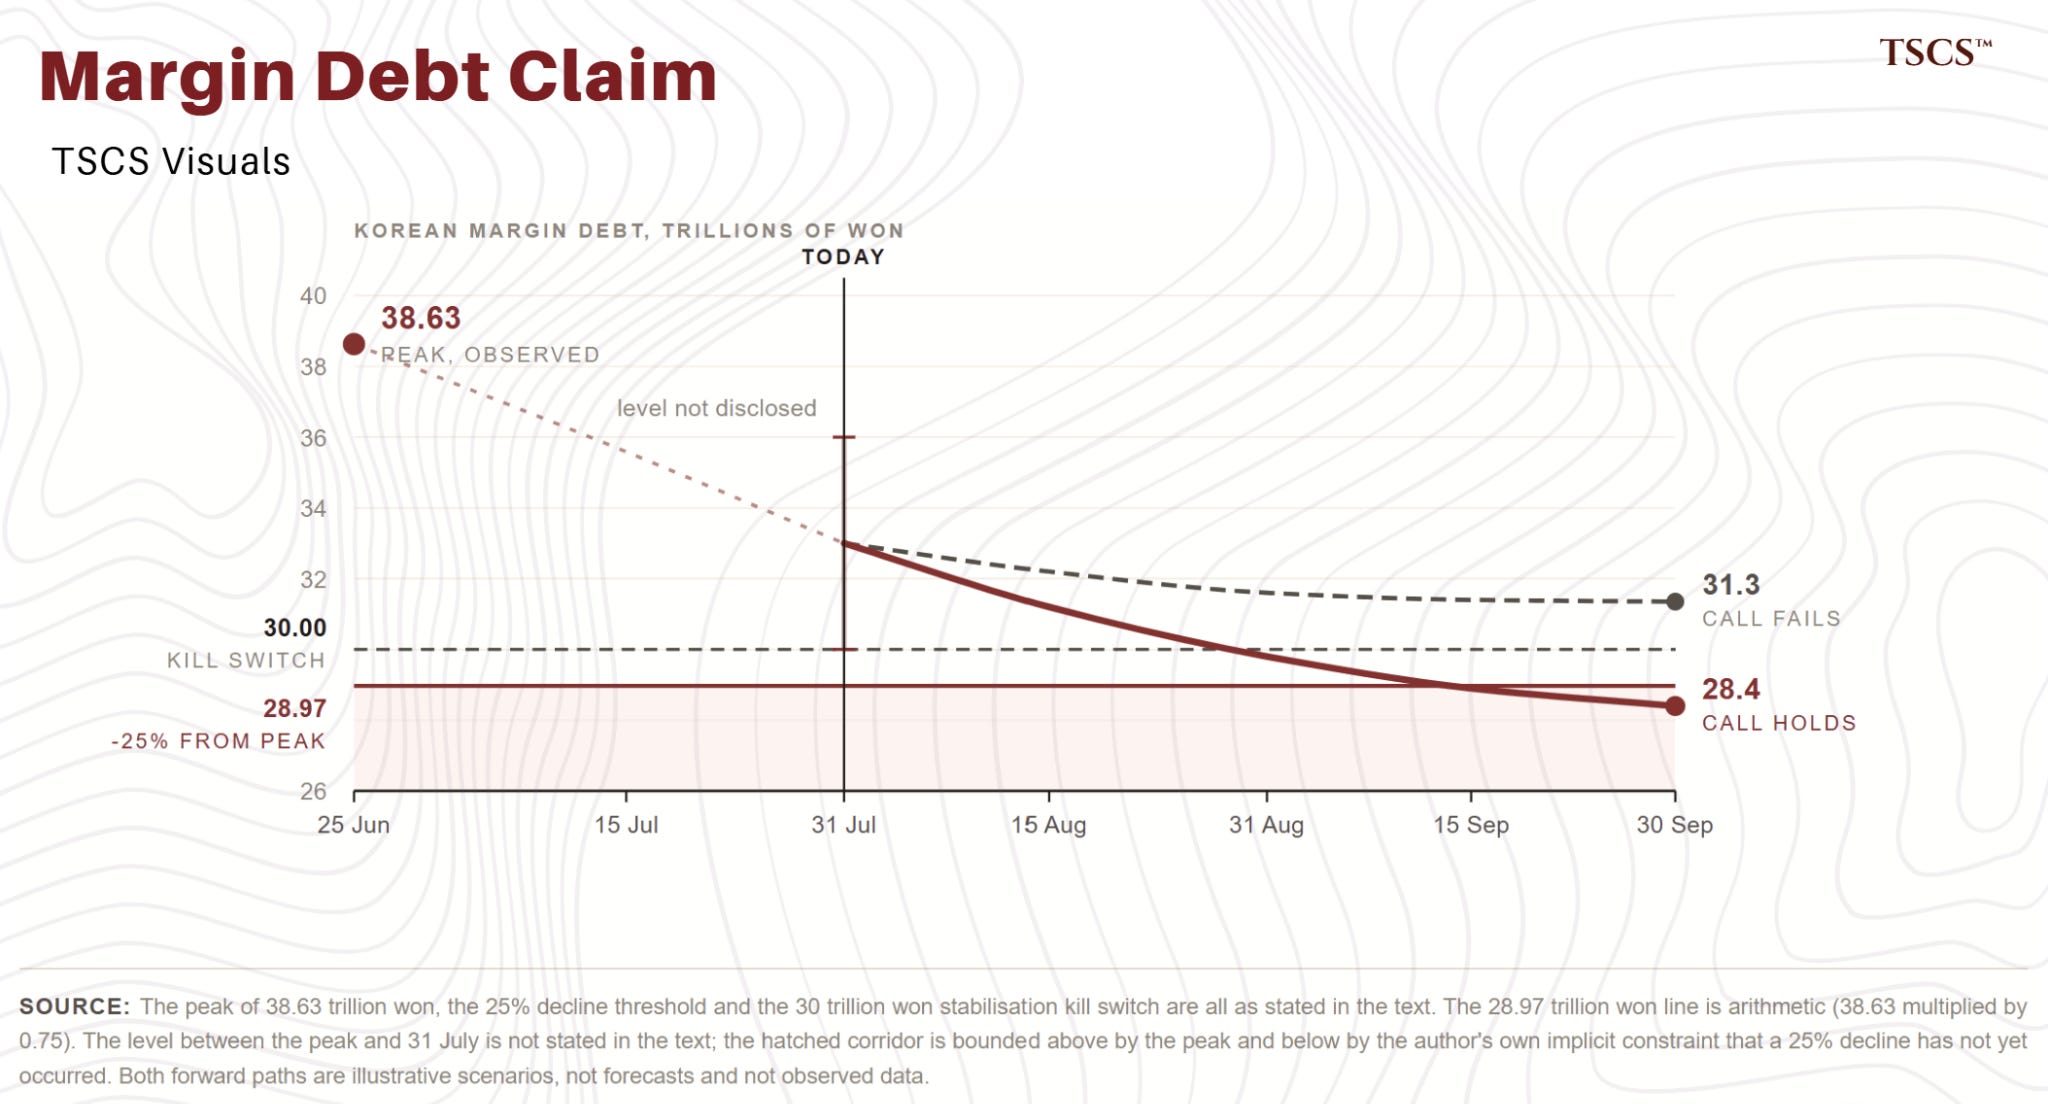
I think Korean margin debt doesn’t recover its June trend before the end of Q3, and the decline from the ₩38.63 trillion peak exceeds 25% before it troughs, which puts the balance below ₩29 trillion. Wrong if it stabilises above ₩30 trillion for a month while the visible liquidation series sits back in its normal range. That would be a completed deleveraging at half the depth of the shallowest episode in 28 years. I’ll let you know if that happens.
The argument above is free. The tracker itself, every series labelled, rerunnable weekly by anyone without credentials, the levels in won, the framework for reading any leveraged unwind, and the kill switches on both sides, are for paid subscribers.
The tracker
Everything above came out of 2 public series and a set of broker rulebooks, and from this week I’ll be publishing the state of the series most Fridays. I’ll also give you the method, so you can rebuild the whole thing yourself rather than take my word for it, which frankly is how I’d want to read a piece like this.
Keep reading with a 7-day free trial
Subscribe to TSCS to keep reading this post and get 7 days of free access to the full post archives.