

There Is No Cloud
$650 billion in hyperscaler capex. Three-year transformer lead times. 75 seconds to thermal runaway. This is the definitive guide to what AI is actually built on. 100+ pages.


The lead time for a single 2-megawatt diesel generator is now 72 to 104 weeks. A power transformer averages 128 weeks. A generator step-up transformer: 144 weeks, nearly three years. Large power transformers can take 210 weeks to deliver. In some primary markets, the wait for a grid connection exceeds seven years.
Meanwhile, the five largest technology companies on earth just committed to spending $600 to $650 billion this year on the buildings that need those generators, those transformers, and those grid connections. Google alone guided to $175 to $185 billion, roughly 51% above what Wall Street expected and nearly double its own 2025 spend. Amazon guided to $200 billion.
This is the most obvious supply-demand mismatch in industrial infrastructure since the post-war housing shortage. The money is here. The equipment is not. The gap between the two is measured in years.
Everyone covering this sector focuses on the demand side: the AI models, the GPU architectures, the hyperscaler earnings calls. That is the easy part, and frankly anyone with a Bloomberg terminal can do it. What nobody has mapped properly is the supply side. The physics. The grid constraints. The cooling. The water. The 44 to 48 week wait for switchgear and 150+ week wait for high-voltage circuit breakers. That is the part that actually determines who makes money and which projects rot on a substation queue for half a decade.
A single NVIDIA Blackwell rack draws 120 kilowatts. If cooling fails, thermal runaway begins in seconds. At legacy 15 kW densities, studies documented 75 seconds to critical temperatures. At 120 kW Blackwell densities, the window is far shorter. Pure thermodynamics. And the operational reality behind every “AI infrastructure” pitch deck currently sitting in your inbox.
These are concrete buildings with a severe physics problem. The tenants are trying to violate the second law of thermodynamics for profit. The landlords are trying to build fast enough to collect rent before the next GPU generation makes the current racks obsolete. The communities hosting these facilities are watching their electricity prices rise, their water tables drop, and their patience evaporate.
I spent months mapping the entire value chain from first principles because nothing at this depth existed for the retail public. Here is what we cover:
The Physics of Compute: Heat rejection, thermodynamic limits, specific heat capacity, and why air cooling is dead above 40 kW per rack. The liquid cooling market doubled to $3 billion in 2025. Goldman Sachs forecasts 76% of AI servers will be liquid-cooled by the end of 2026.
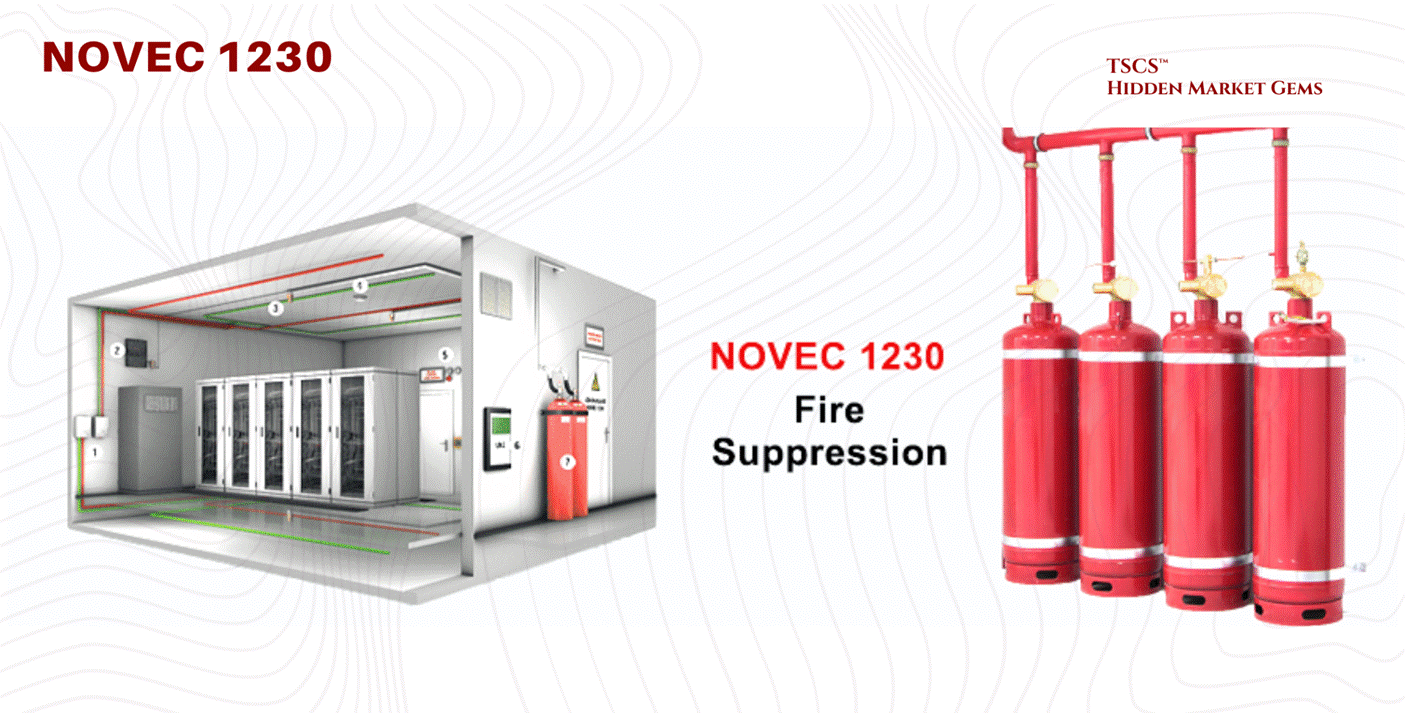
The Industrial Reality: Power backup, electrical distribution, fire suppression (the Novec 1230 phase-out completed in December 2025, but the molecule lives on under different brands), and the engineering that keeps these buildings alive when the grid fails.
The AI Density Shock: Blackwell is shipping at scale. Vera Rubin is announced for H2 2026 with 5x the inference performance. The thermal issues are resolved. The power demands are not.
The Bottlenecks: Equipment lead times. Water regulation accelerating across 15+ states. A grid that cannot expand fast enough. Nuclear commitments from big tech now exceed 10 GW, but the HALEU fuel supply to power those reactors stands at roughly 1 metric ton produced via enrichment (with DOE planning to supplement through HEU downblending from defence stockpiles) against a need for 40 tons by end of decade.
And frankly, nothing like this has ever been published for the retail public before.
I would go far enough as to say that this is quite literally the bible of data centers.
This document takes you from zero to expert in a single read.
The equity breakdown is live behind the paywall (here). We are publishing an updated version this week (March 2026) with fresh positioning. Free subscribers get the diagnosis. Paid subscribers get the trade.
There is no cloud. There is only a concrete building connected to a power grid that was built for a world that no longer exists, cooled by systems that are being redesigned in real time, and supplied by an equipment industry that cannot build fast enough.
This post was a collaboration with Hidden Market Gems
Why You Need to Be Reading TSCS
At TSCS, we’ve made it our mission to uncover hidden opportunities before the crowd. Our community is built for investors who want an edge: institutional-grade analysis, creative frameworks, and a proven record of outperformance.
This isn’t just research, it’s a blueprint for compounding wealth with conviction.
In recent months, we’ve published sector deep-dives such as:


We also provide ruthless stock-specific analyses, highlighting hidden moats and catalysts the market has barely begun to price as well as actionable thematics:


If you want to understand not only where markets are headed, but also how to capture hidden compounding opportunities, you need to be here.
Welcome to the real world. Let’s get into it.
Module 1: Foundations (What a Data Center Is)
1.1 Historical Geography
To understand the data center, you must understand its history.
You might think the internet lives in Silicon Valley, nestled between a yoga studio and a VC firm on Sand Hill Road. You’d be wrong.
A massive chunk of the financial internet, the part that actually moves money, lives in a swamp in New Jersey. Specifically, Secaucus.
Why Secaucus? Because history has a sense of irony that no fiction writer could invent. In the early 1900s, Secaucus was known for pig farms. At its peak during World War II, this town hosted 250,000 pigs, outnumbering humans 16 to 1.
It was the garbage disposal for New York City’s restaurant waste. The town smelled so bad that travelers on the nearby trains would roll up their windows as they passed to avoid the stench of fermenting refuse and biological metabolism.
Fast forward to today. The pigs are gone, incinerated or regulated away. In their place, we have Equinix NY4 and NY5, massive fortresses of digital processing.
The smell of pig shit has been replaced by the sterile, ozonated smell of hot electronics and burning ozone. But the function is exactly the same. Secaucus is still the metabolic engine for New York City. Instead of turning food scraps into bacon, it turns trade orders into liquidity.
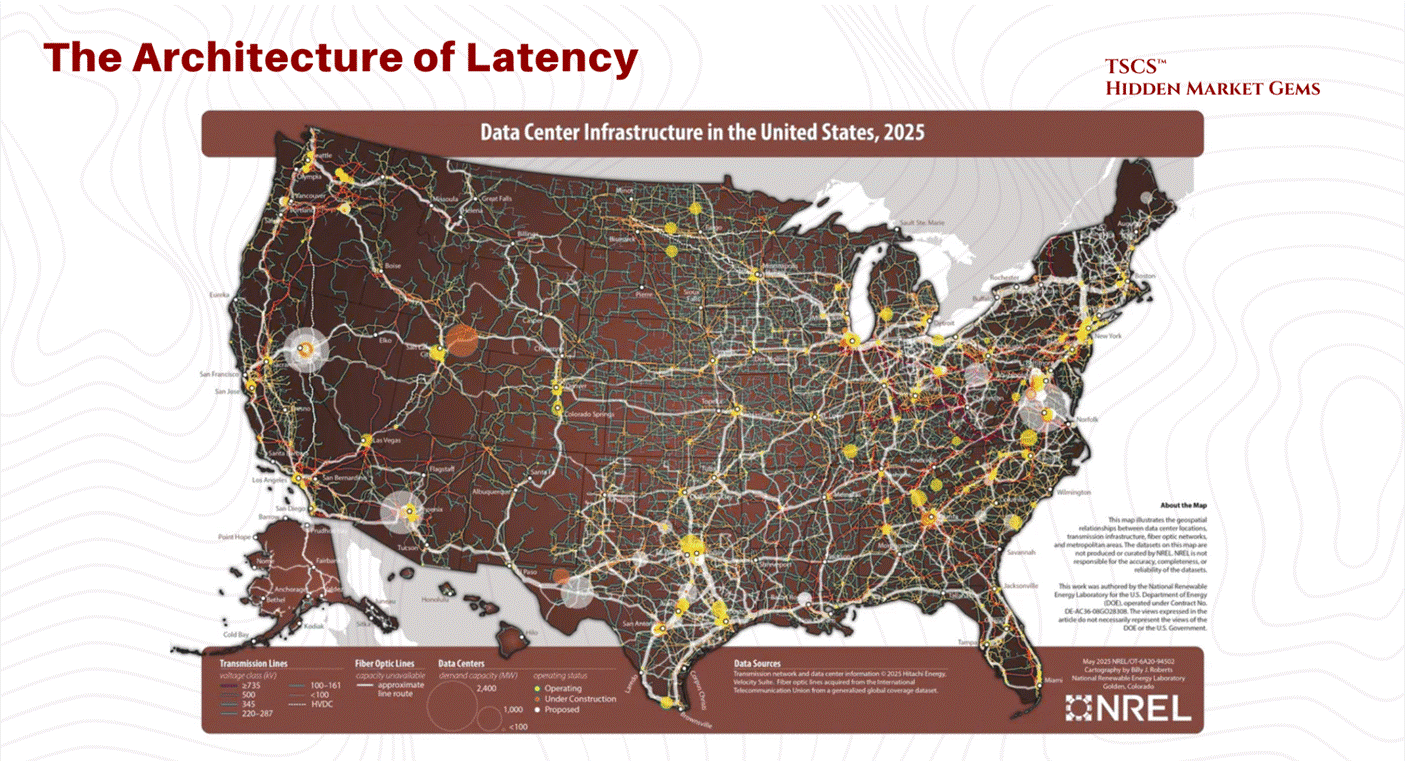
We build these data centers in swamps for a reason. Swamps are flat. Swamps are near the cities but distinct from them (you don’t want the noise and the power draw in Manhattan). And swamps are cheap (or they used to be before the hyperscalers showed up). The geography of data centers is dictated by three things:
Power: You need a fat pipe to the grid.
Fiber: You need to be on the “backbone.”
Risk: You want to be close to the customer, but not so close that a nuclear bomb hitting the city takes you out too.
This is the reality of the “Cloud.” It is rooted in the mud. It is built on top of pig farms. And it is about to face a resource crisis that no amount of Python code can solve.
If you want to know about some aspects of geographies on data centers, you should look at the posts by these writers:
Ben Lockwood, Ph.D. 🎄 with two posts I found interesting being “Data Centers, Development, and Dispossession In Pennsylvania,” and “No Desert Data Centers, climate impacts on boreal forests, and the quiet eco-horror of Rebecca Campbell’s The Other Shore” as well as posts from 310 Value “Data Centers in the Permian Basin Part 3 - First Comes Power” and finally Dave Bondy’s “Michigan’s Data Center Debate: The Full Picture of Pros, Cons, and What Experts Say.”
1.2 The Concrete Shell & CapEx
1.2.1 It's Just a Warehouse
A data center is a warehouse. It is a tilt-up concrete box. But unlike an Amazon warehouse that stores plastic from China, this warehouse stores servers. And unlike plastic, servers eat electricity and emit heat.
The fundamental unit of the data center is not the “byte.” It is the Megawatt (MW). We don’t measure these buildings in square feet anymore; we measure them in power capacity. “I’m building a 100MW campus” is the standard flex in the industry today. If you talk about square footage, you are revealing yourself as an amateur.
The Economics of the Shell:
The construction cost of these facilities is exploding. Why? Because you are pouring concrete and buying steel in an inflationary environment, and you are competing with every other hyperscaler for the same skilled labor and the same switchgear. And the checks being written are getting obscene.
March 2026 Update: Q4 2025 earnings calls revealed 2026 capital expenditure guidance that blew past every prior estimate. Alphabet guided $175 to $185 billion, nearly double 2025’s actual $91.4 billion and roughly 51% above the Street consensus of $119.5 billion. Amazon guided approximately $200 billion, up from $131.8 billion, obliterating the Street’s $146.6 billion estimate so thoroughly that the stock dropped 8%. Meta guided $115 to $135 billion, up 59 to 87% from 2025’s $72.2 billion. Microsoft does not provide full-year capex guidance (its fiscal year ends June 30), but H1 FY2026 alone totaled $72.4 billion including finance leases, implying a $145 billion annualized run rate. Analyst consensus clusters around $110 to $120 billion.
Combined Big Five (Amazon, Alphabet, Microsoft, Meta, Oracle) 2026 capex is projected at $660 to $750 billion. That is the largest single-year corporate infrastructure commitment in history. Goldman Sachs revised its 2026 hyperscaler estimate to $667 billion; CreditSights moved to $750 billion. Jensen Huang frames $700 billion as the floor, not the ceiling. Goldman initially projected cumulative 2025 to 2027 capex of approximately $1.15 trillion (subsequently revised upward to roughly $1.4 trillion in October 2025), more than double the $477 billion spent in 2022 to 2024. Even the $1.4 trillion figure now looks conservative. Capital intensity reaches 45 to 57% of revenue for some hyperscalers (Oracle at 57%, Microsoft at 45% on a most-recent-quarter basis). Free cash flow concerns are mounting: Barclays projects Meta’s FCF declining roughly 90% in 2026, and hyperscalers issued $121 billion in bonds in 2025 while holding more debt than cash for the first time.
DeepSeek’s efficiency breakthrough had zero dampening effect. Every major hyperscaler reaffirmed or increased spending, invoking Jevons’ Paradox: efficiency gains accelerate total adoption, they do not reduce infrastructure demand. Meanwhile, 25% tariffs on steel imports (effective March 2025) and potential semiconductor tariffs under investigation are adding 3 to 5% to data center construction costs (CBRE), compounding the existing supply chain constraints.
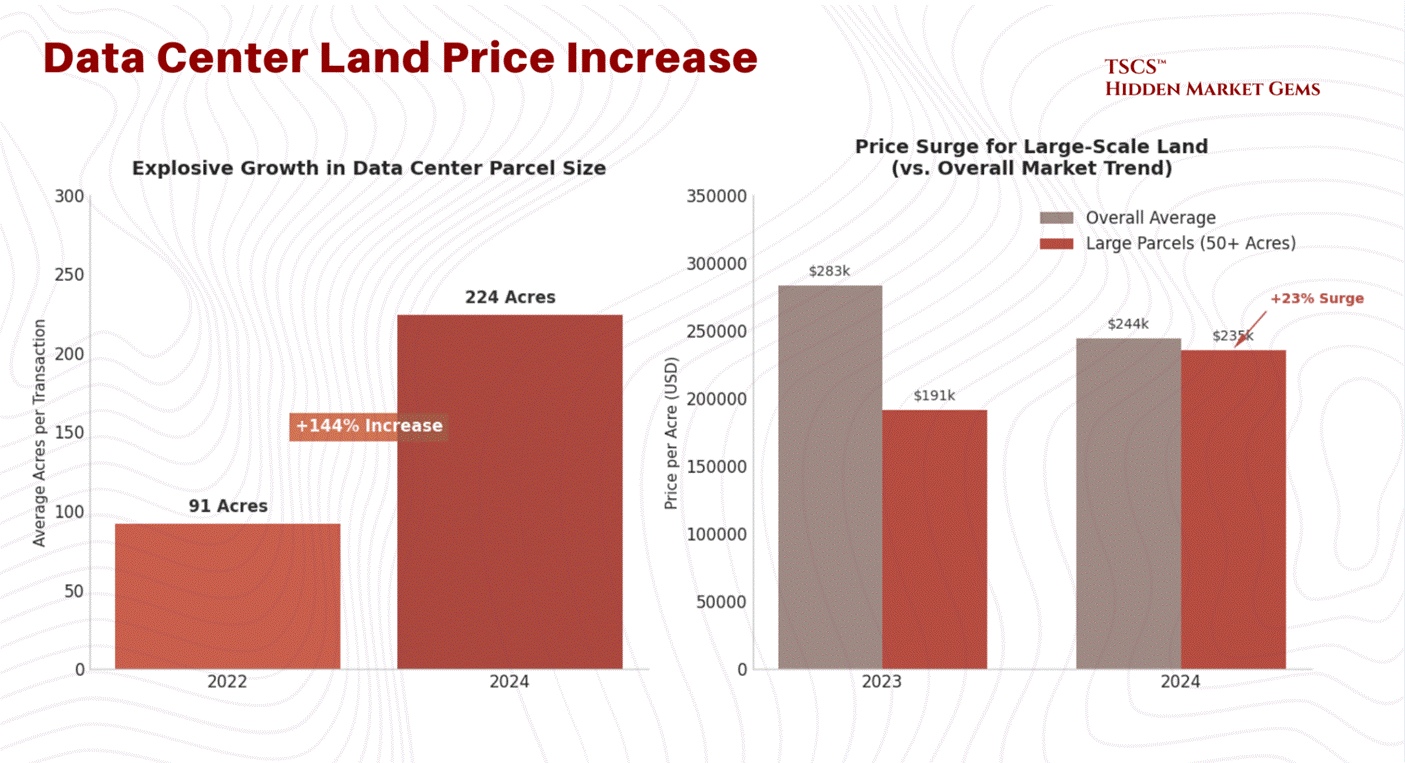
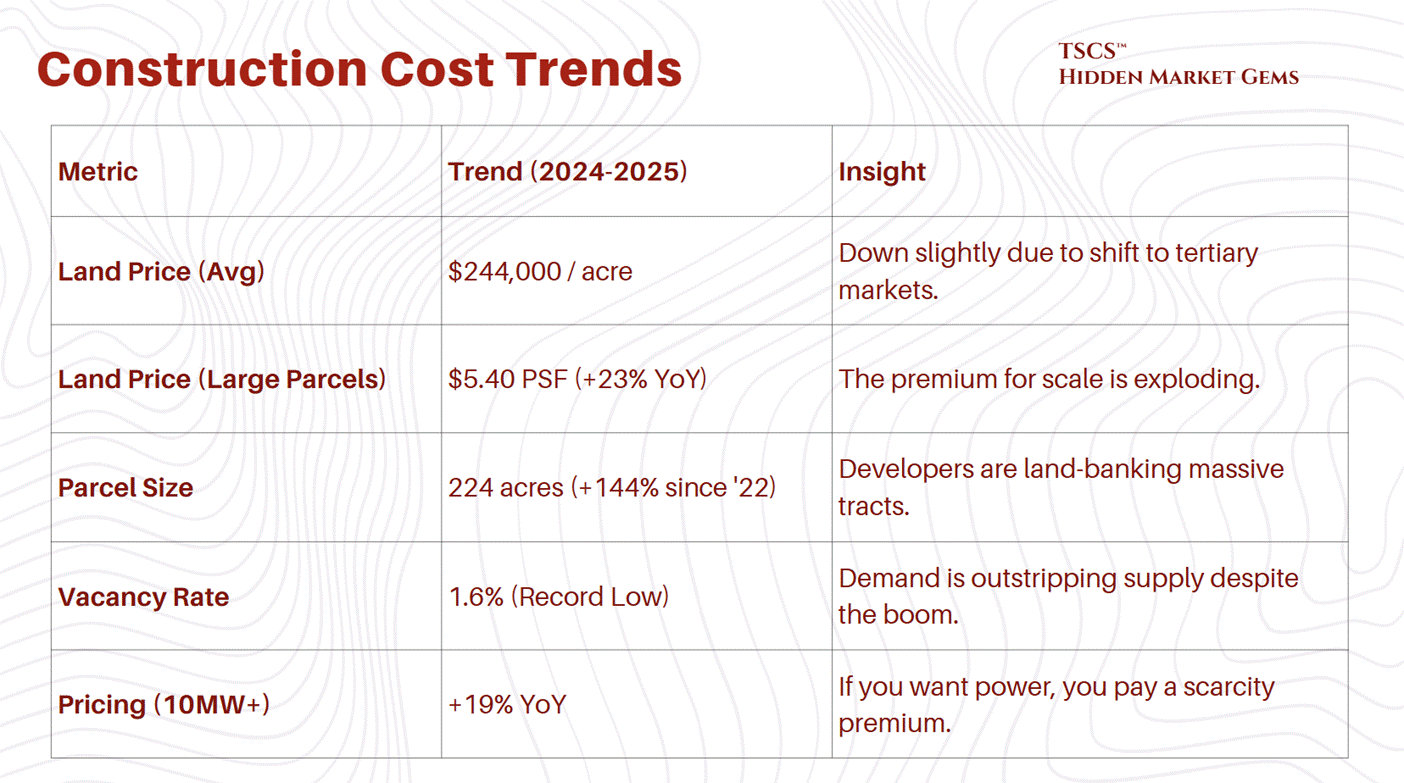
The weighted average cost of data center land in the U.S. was $244,000 per acre through October 2024. That sounds reasonable until you realize that developers are desperate for scale. They need massive campuses to achieve the economies of scale required by AI. The price for large parcels, 50 acres or more, has surged 23% year-over-year.
March 2026 Update: This weighted average ($5.59/sq ft per Cushman & Wakefield) actually decreased by $39,000/acre from the prior year, but the average is almost meaningless given the divergence across markets. Northern Virginia (Loudoun County) land now trades at $2 to $4 million+ per acre, with a November 2025 transaction closing at $6 million per acre. Prince William County approaches $1 million. Phoenix ranges from $200K to $500K. Texas remains more affordable. The average parcel size has grown to 224 acres, a 144% increase since 2022, as hyperscalers pursue campus-scale developments that make per-acre pricing less relevant than total site control.
Why the premium for size? Because the hyperscalers want to build “multi-building campuses.” They want to lock in the land now so they can expand later without negotiating with a new landlord. The average parcel size for a transaction has ballooned to 224 acres in 2024, a 144% increase since 2022. They are buying up entire zip codes.
1.2.2 Material Intensity
The sheer volume of raw materials required to build these things is staggering. A single hyperscale AI data center requires up to 20,000 tons of steel. To put that in perspective, that’s roughly the weight of two Eiffel Towers, just for the skeleton of one facility.
Then there is the concrete. The American Cement Association predicts the U.S. will need 1 million metric tons of cement by 2028 just for AI data centers. Cement (the binding agent in concrete) is one of the most carbon-intensive materials on Earth. Cement production accounts for approximately 8% of global CO2 emissions.
This makes the “Green Data Center” narrative absolutely hilarious. You have companies like Microsoft and Google pledging to be “Carbon Negative” by 2030, yet they are pouring millions of tons of concrete to house servers that burn gigawatts of power. It is the height of corporate hypocrisy. They are trying to greenwash this by building data centers out of “cross-laminated timber” (wood) to reduce embodied carbon. It is adorable. It’s like putting a filtered cigarette in the mouth of a coal plant and calling it “health-conscious.”
The reality is that this is a heavy industry. It is extractive. It consumes land, steel, and concrete at a rate that rivals the industrial revolution. And the costs are only going up. While building costs are “decelerating,” they are still rising. The days of cheap infrastructure are over.
We looked at the economic reality of AI Capex in our post:

Michael Spencer also looked at the capex for AI Infrastructure in his post “McKinsey’s Cost of Compute AI Infrastructure Analysis.”
Also do not overlook HVAC risk. Legionella is one of many.
1.2.3 Supply Chain Choke Point
It’s not just about the cost of materials; it’s about the time it takes to get them.
The lead time for a single 2 MW diesel generator now sits at 72 to 104+ weeks, per Stream Data Centers' procurement data. That is not a typo. You are waiting two full years for a single generator.
And generators are not even the worst bottleneck. Power transformers average 128 weeks (WoodMac Q2 2025). Generator step-up transformers: 144 weeks, nearly three years. Large power transformers: up to 210 weeks in some cases. Switchgear, which used to be a sub-30-week item, now averages 44 to 48 weeks (WoodMac Q2 2025 / Cushman & Wakefield 2025), while high-voltage circuit breakers have surged past 150 weeks.
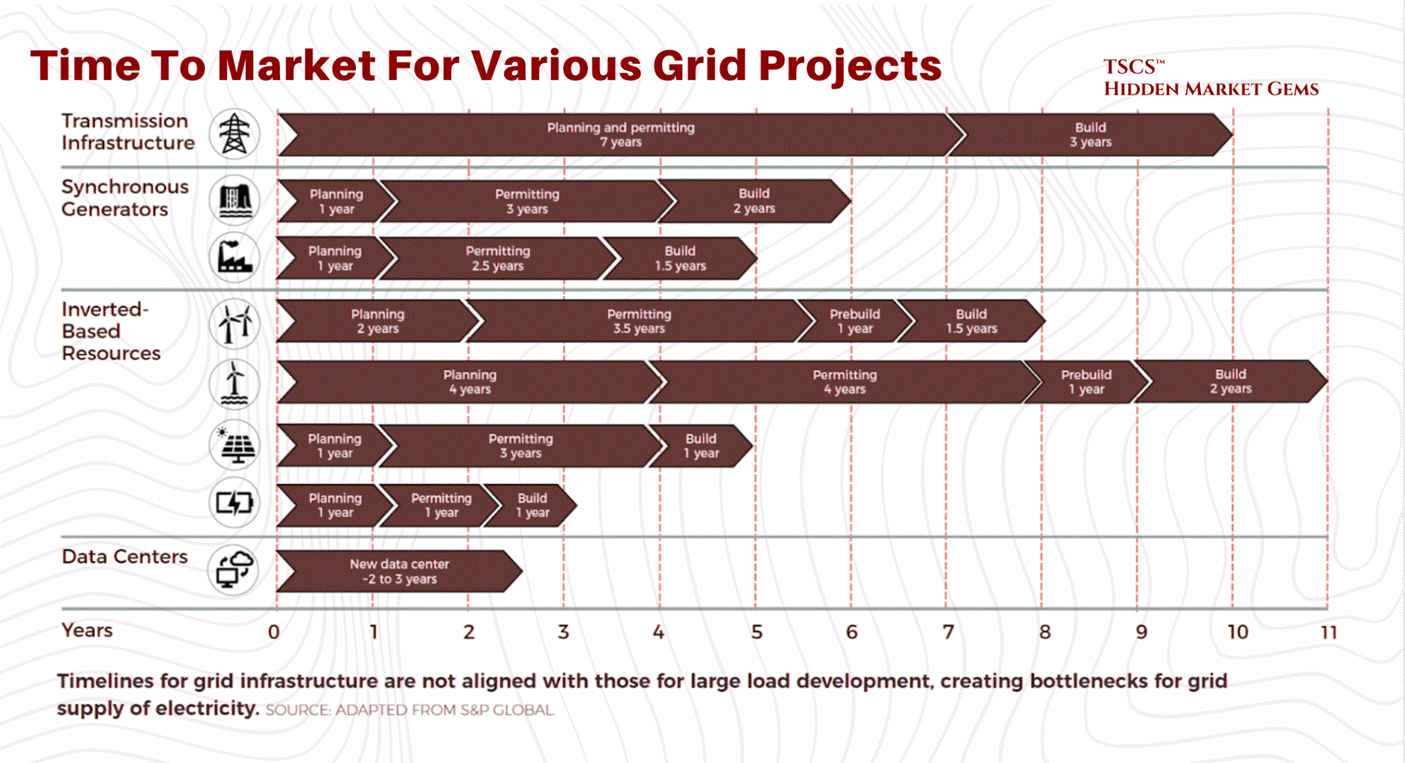
Grid connection wait times in primary markets now exceed 4 to 7 years. JLL reports that 57% of data center projects faced delays of 3+ months in 2025, and developers are preordering critical equipment up to 24 months before breaking ground. WoodMac models a 30% shortfall for power transformers across the U.S. fleet, with more than half of the nation's roughly 40 million distribution transformers already beyond their expected service life.
Long-lead equipment is no longer a constraint. It is the constraint. Every project timeline in 2026 is dictated by transformer and generator procurement, full stop.
This creates a massive barrier to entry. If you didn’t order your switchgear two years ago, you aren’t building a data center today. This favors the incumbents who have the balance sheet to forward-order equipment for buildings they haven’t even designed yet.
It creates a “haves and have-nots” dynamic. The hyperscalers and large REITs have the supply chain locked down. The smaller players are left scavenging for scraps. This is why vacancy rates in primary markets are at record lows, 1.6% in H1 2025. If you want space, you can’t find it. And if you find it, you are going to pay through the nose for it.
This figure, sourced from CBRE's H1 2025 data, has since been superseded. CBRE's H2 2025 report (released February 2026) shows North American vacancy tightened further to 1.4%, a new record low, with record net absorption of 2,497.6 MW across 2025. Northern Virginia colocation vacancy sat at an extraordinary 0.72% in the same period. If anything, the imbalance has intensified: 74.3% of all capacity under construction is now preleased, with commitments extending to deliveries in 2027 and beyond. Global occupancy reached 97% (JLL), pushing colocation pricing above $200/kW/month for large requirements. JLL projects vacancy will remain below 5% through 2027, hovering around 2%.
1.2.4 Construction Cost Trends
The following table summarizes the construction cost trends. Note the divergence between general building costs and the specific costs associated with data centers due to their complexity.
1.3 Power & Redundancy
1.3.1 N+1 vs. 2N
In the real world, things break. Entropy is the only law that is actually enforced. In the data center world, if things break, you lose your job, your stock crashes, and your client sues you for breach of SLA (Service Level Agreement).
The industry measures reliability in a variable called “N.” “N” is the need. It is the minimum capacity required to run the IT load.
N: This is the bare minimum. You need 10 MW to run the servers? You have 10 MW of power gear. If a generator blows up, you go dark. This is for amateurs, crypto-miners, and people who like to live dangerously.
N+1: You need 10 generators? You buy 11. If one breaks, the spare kicks in. This is the standard “efficient” model. It’s cheaper, scalable, and “good enough” for most non-critical workloads.
2N: Paranoia mode. You need 10 MW? You build two completely separate 10 MW power paths. Two utility feeds, two sets of generators, two sets of UPS (Uninterruptible Power Supply) systems. If the entire A-side blows up, the B-side doesn’t even blink.
TSCS’ Note on Redundancy:
Intellectuals, consultants, and MBAs love N+1 because it is “efficient.” It optimizes Return on Invested Capital (ROIC). They look at the spreadsheet and say, “Why pay for 2N when the probability of a dual failure is 0.00001%?”
Because, you morons, in complex systems, probabilities are not Gaussian. Failures are correlated. When the grid goes down, it often takes the “backup” logic with it. Or the hurricane floods both the primary and the secondary intake.
2N is expensive. It requires double the gear, double the copper, double the space. It is a massive drag on efficiency. But it is antifragile. When the black swan event hits, the N+1 facility is praying the transfer switch works. The 2N facility is boringly operational.
The cost premium for this paranoia is massive, but the cost of downtime is higher. For a large organization, downtime costs $9,000 per minute. That is $540,000 per hour. If you are a high-frequency trading firm, a minute of downtime is an extinction event. You pay for the 2N.
This is exactly why AI Infrastructure is extremely risky. John Hwang actually made a great post regarding the startup field called: “Why AI Infrastructure Startups Are Insanely Hard to Build.”
1.3.2 Tiers of Reliability
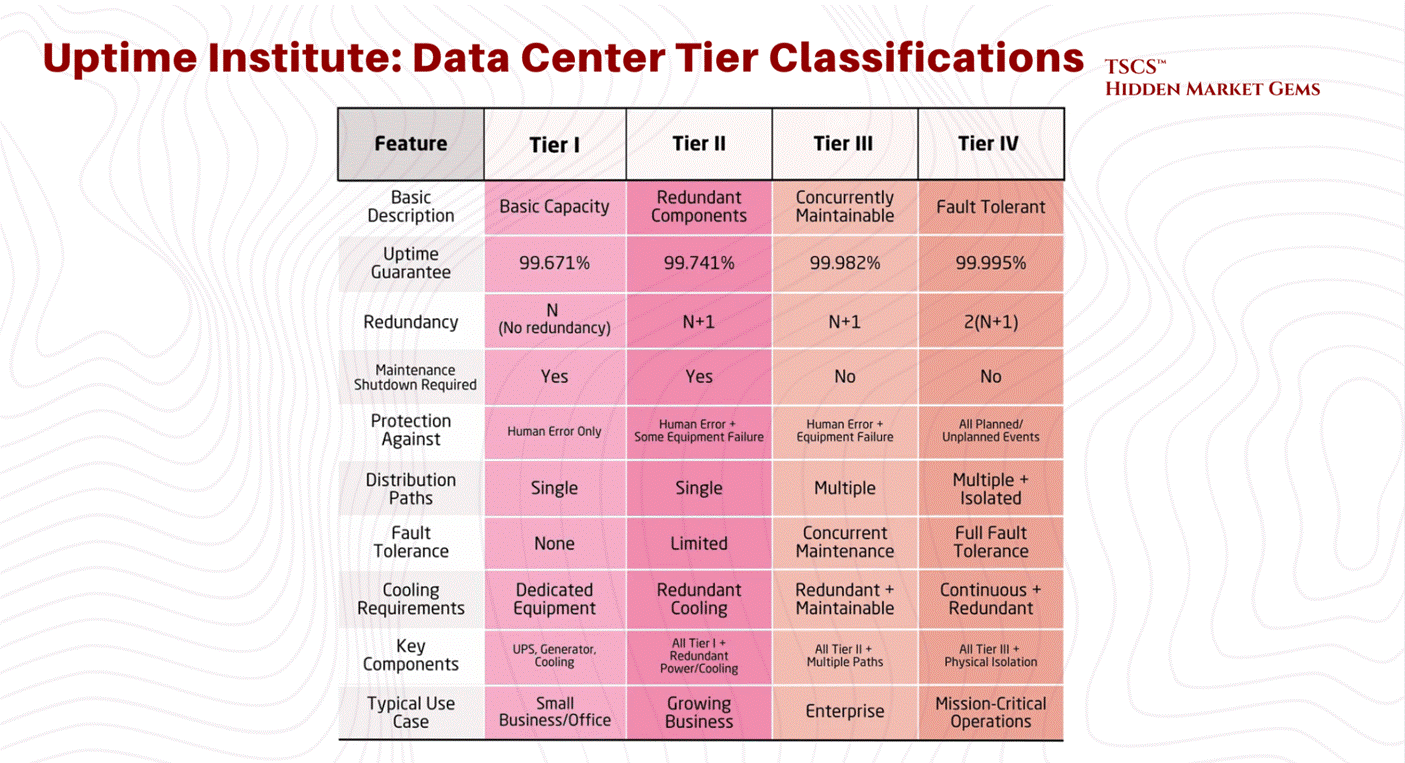
The Uptime Institute defines Tiers (I, II, III, IV) based on this redundancy.
Tier I: N capacity. Basically a server closet with an AC unit. 99.671% availability.
Tier III: N+1. Concurrently maintainable. You can fix a piece of gear without shutting down the room. 99.982% availability. This is the industry standard for most colocation.
Tier IV: 2N+1. Fault tolerant. Everything is redundant. 99.995% availability. This is for the banks and the military.
The move to the Cloud has actually lowered the average tier of the physical layer. AWS doesn’t build Tier IV data centers. They build cheap, N+1 “availability zones” and rely on software to handle the redundancy. If one building goes dark, the workload shifts to another. They have shifted the redundancy from the atoms (concrete and copper) to the bits (software).
This works great until a software bug takes down the entire region (us-east-1), proving once again that you cannot code your way out of physics.
1.3.3 Power Availability Crisis
The single biggest constraint in 2025 is not land or fiber; it is power.
Dominion Energy in Northern Virginia is tapped out. They have had to pause new connections. The grid cannot keep up with the demand. And the regulatory environment has shifted from accommodating to hostile.
March 2026 Update: The political backlash is now bipartisan. Both Bernie Sanders and Ron DeSantis have spoken against unchecked data center expansion. More than 230 organizations have signed a letter calling for a national moratorium on data center construction. On February 25, 2026, President Trump announced the "Ratepayer Protection Pledge," requiring major tech companies to pay for their own power needs. The free ride on residential ratepayers is over.
Virginia’s SCC created a new GS-5 rate class effective January 1, 2027, requiring customers demanding 25+ MW to sign 14-year contracts and pay minimum demand charges covering infrastructure costs regardless of actual usage. Dominion’s authorized base rate increases total $775.6 million across 2026 to 2027 (the SCC approved $775.6 million of Dominion’s $1.167 billion request, meaning even the regulator thought Dominion was asking for too much). The 2026 General Assembly session saw multiple data center reform bills filed, including HB155 requiring SCC review of high-power facilities before grid connection.
PJM’s capacity market crisis has deepened beyond what anyone modeled. The 2026/2027 auction cleared at the FERC-approved cap of $329.17/MW-day, with data centers driving 40% of capacity costs. The subsequent 2027/2028 auction (December 17, 2025) cleared even higher at $333.44/MW-day, also at the FERC cap, and critically fell short of PJM’s own reliability requirement. That last part bears repeating: PJM could not procure enough generation to meet its own forecast. Data center load accounted for roughly 5,100 MW of the 5,250 MW increase in peak load between the two auctions. Across the last three PJM auctions, data center forecast costs totaled $21.3 billion, or 45% of total costs. NRDC estimates PJM consumers could pay $163 billion extra through 2033.
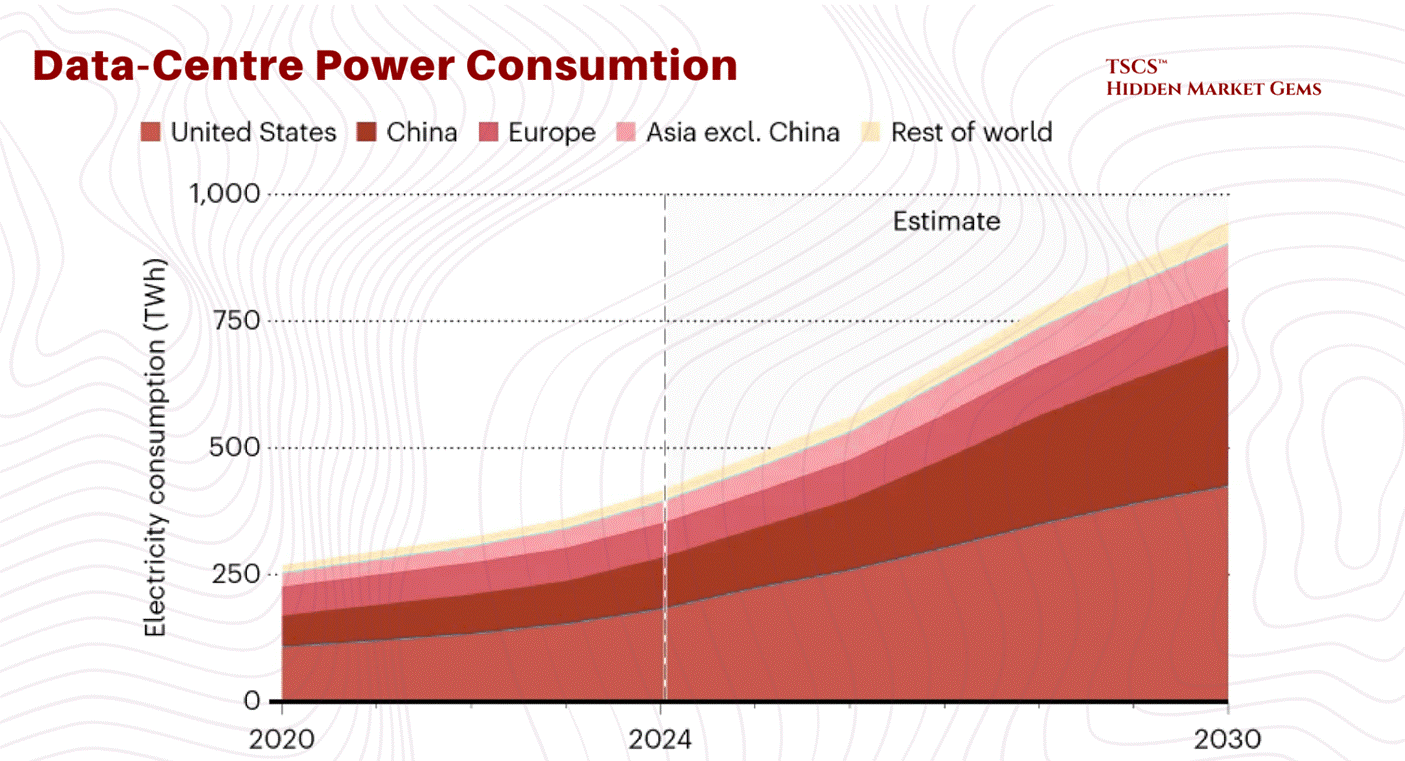
The IEA’s April 2025 “Energy and AI” report projects global data center electricity demand will more than double to roughly 945 TWh by 2030, while Goldman Sachs forecasts 175% growth by 2030.
The doubling scenario remains the central case. The tripling scenario increasingly looks like an upper bound rather than a base expectation, though it cannot be ruled out given the capex acceleration described above.
PJM's January 2026 load forecast update cut near-term peak demand projections through 2032 by 4.4 GW (2.6%) due to stricter data center vetting, but increased long-term 10-year growth to 3.6% annually (up from 3.1%), projecting 222 GW by 2036. Jefferies characterized the near-term revision as "pushouts and delays, not weakness in demand."
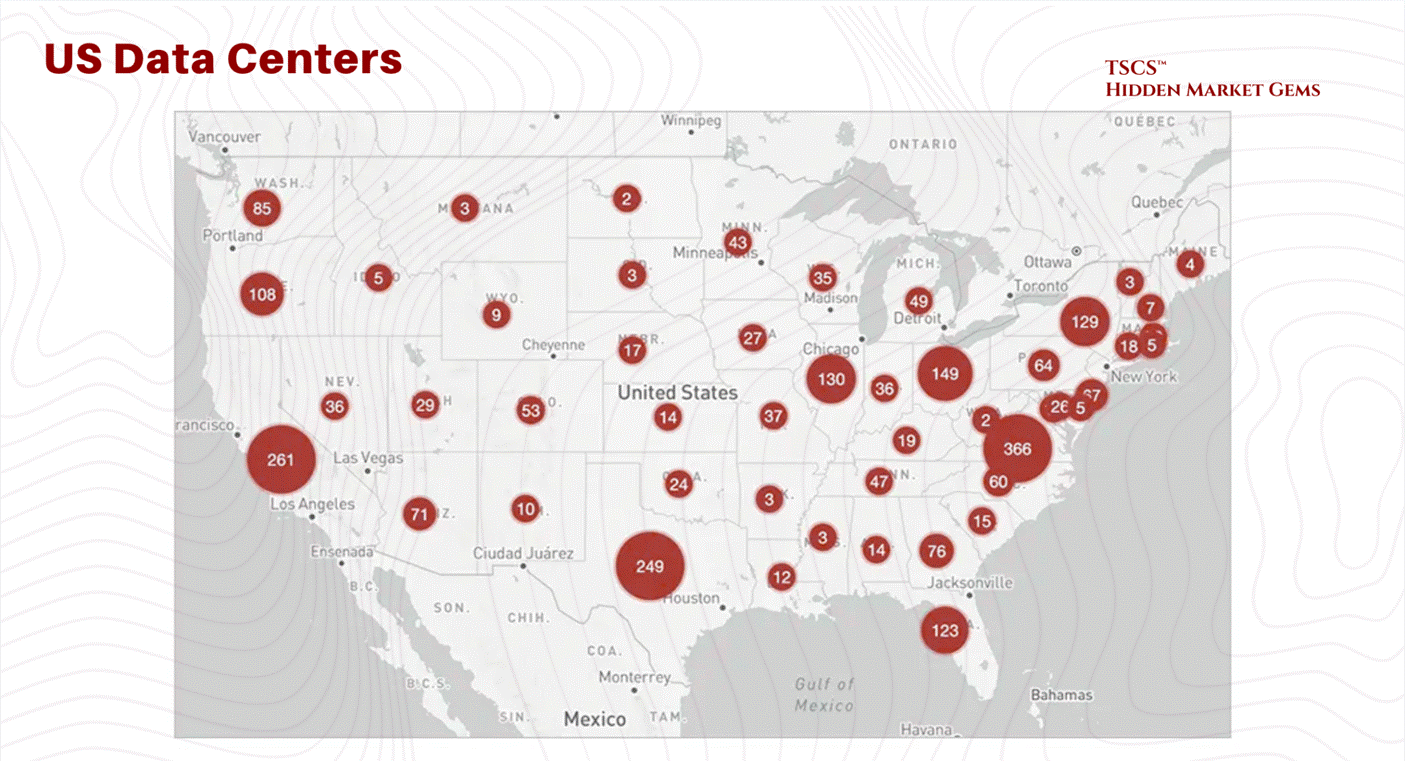
This has forced developers to move to “tertiary markets”, places like Columbus, Ohio; Hillsboro, Oregon; and wherever else they can find a utility company willing to sell them 500MW of juice.
We are seeing a reversion to the mean. The concentration in Ashburn was an anomaly. Now, the electrons are dictating the geography. You go where the power is. If that means building a data center in the middle of a cornfield in Iowa, so be it.
Chamath Palihapitiya explained USA’s electric grid bottle neck in his post “Deep Dive: The Electric Grid - America’s Biggest Bottleneck of the Decade.”
Global Data Center Hub also did an interesting angle on this section “Why AI Is Forcing a Complete Rethink of Data Center Design.”
1.4 Thermodynamics
1.4.1 The Entropy Problem
Computers are essentially heaters that do a little bit of math on the side. When you pump electricity into a silicon chip, almost all of that energy is converted into heat. A data center is a giant machine that converts valuable electricity into waste heat.
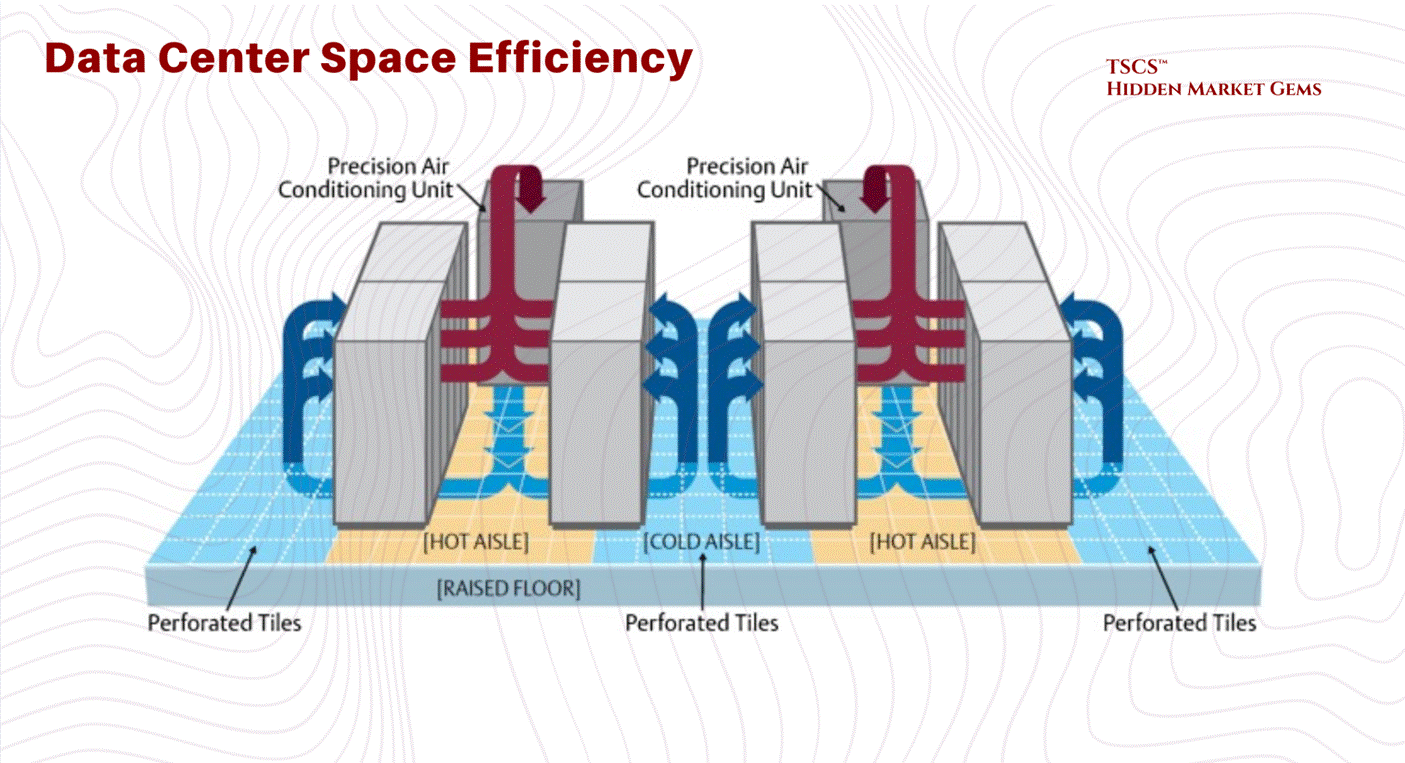
For the last 20 years, we have relied on Air Cooling. We blow cold air from the floor (the “cold aisle”) through the server racks, the servers get hot, and we suck the hot air out the back (the “hot aisle”). It’s crude, but it worked because processors weren’t that dense.
1.4.2 Thermodynamic Limit of Air
The laws of physics have caught up with the industry. Air is a terrible conductor of heat. Its specific heat capacity is garbage compared to water.
Legacy Density: A standard rack of servers used to draw 5-10 kW. Air could handle that easily.
The AI Shock: Then came Nvidia. Then came the H100s and the Blackwells. An AI training rack can draw 40, 60, even 120 kW.
You cannot cool a 100 kW rack with air. It is physically impossible. You would need a hurricane-force wind blowing through the server room. The fans alone would consume 20% of the power. We have hit the Thermodynamic Limit of Air Cooling.
If you try to air-cool these racks, the temperature spikes from 72°F to over 90°F in 75 seconds if the AC fails. It is a thermal runaway event waiting to happen.
1.4.3 Liquid Cooling
This forces a paradigm shift that scares the hell out of traditional operators: Liquid Cooling.
Water conducts heat 23.5 times better than air. It has 3,500 times the heat-carrying capacity by volume.
If you want to run high-density AI, you have to bring liquid directly to the chip (Direct-to-Chip) or dunk the whole damn server in a bath of dielectric fluid (Immersion Cooling).
The Implications:
Retrofit Nightmare: You can’t just shove a liquid-cooled rack into an old air-cooled data center. You need plumbing. You need Coolant Distribution Units (CDUs). You need to worry about leaks. Water and electricity, famously, do not mix.
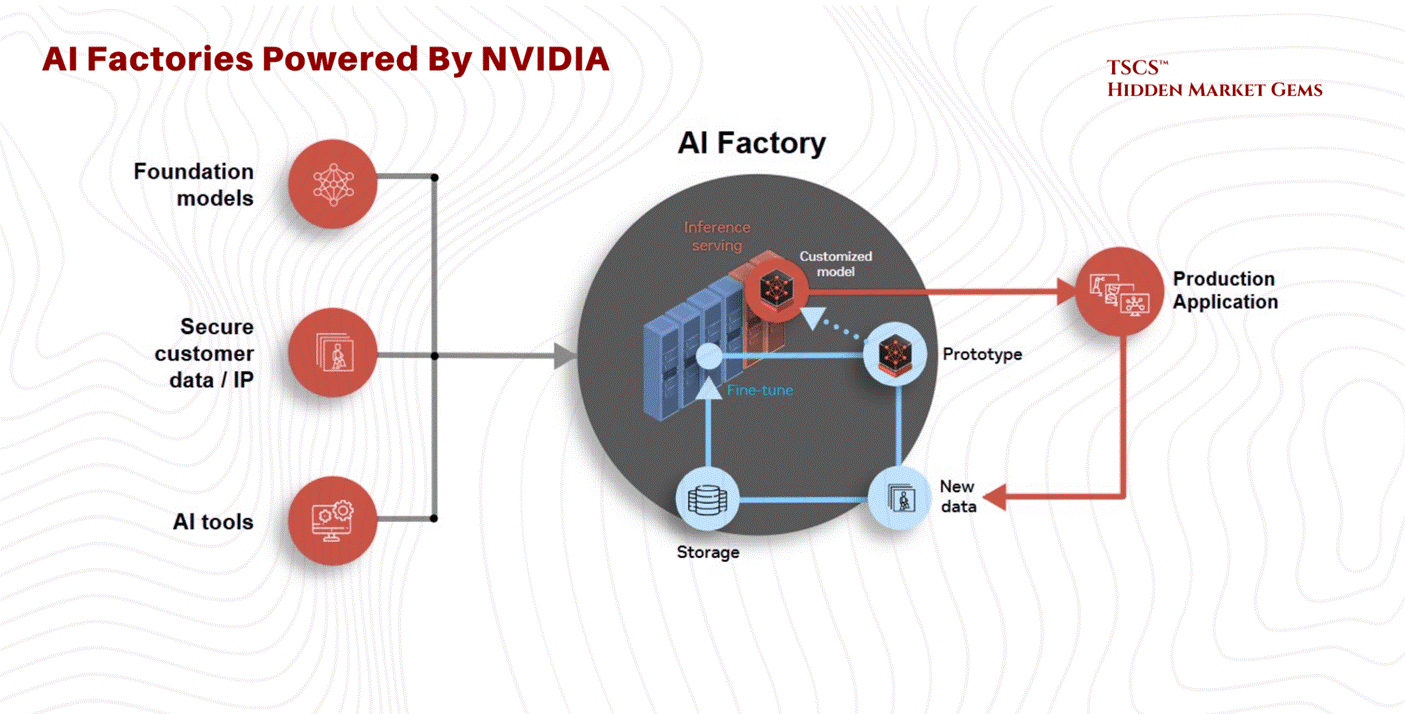
The “AI Factory”: Jensen Huang calls the new data centers “AI Factories”. He is right. They are industrial plants. They look less like office buildings and more like chemical refineries.
Obsolescence: If you own a portfolio of 10-year-old data centers designed for 5 kW racks, you are holding a bag of stranded assets. You are the landlord of a Blockbuster Video in the age of Netflix. The “Oberon” system marked the end of the retrofitting era.
1.4.4 PUE
The industry tracks efficiency using PUE (Power Usage Effectiveness).
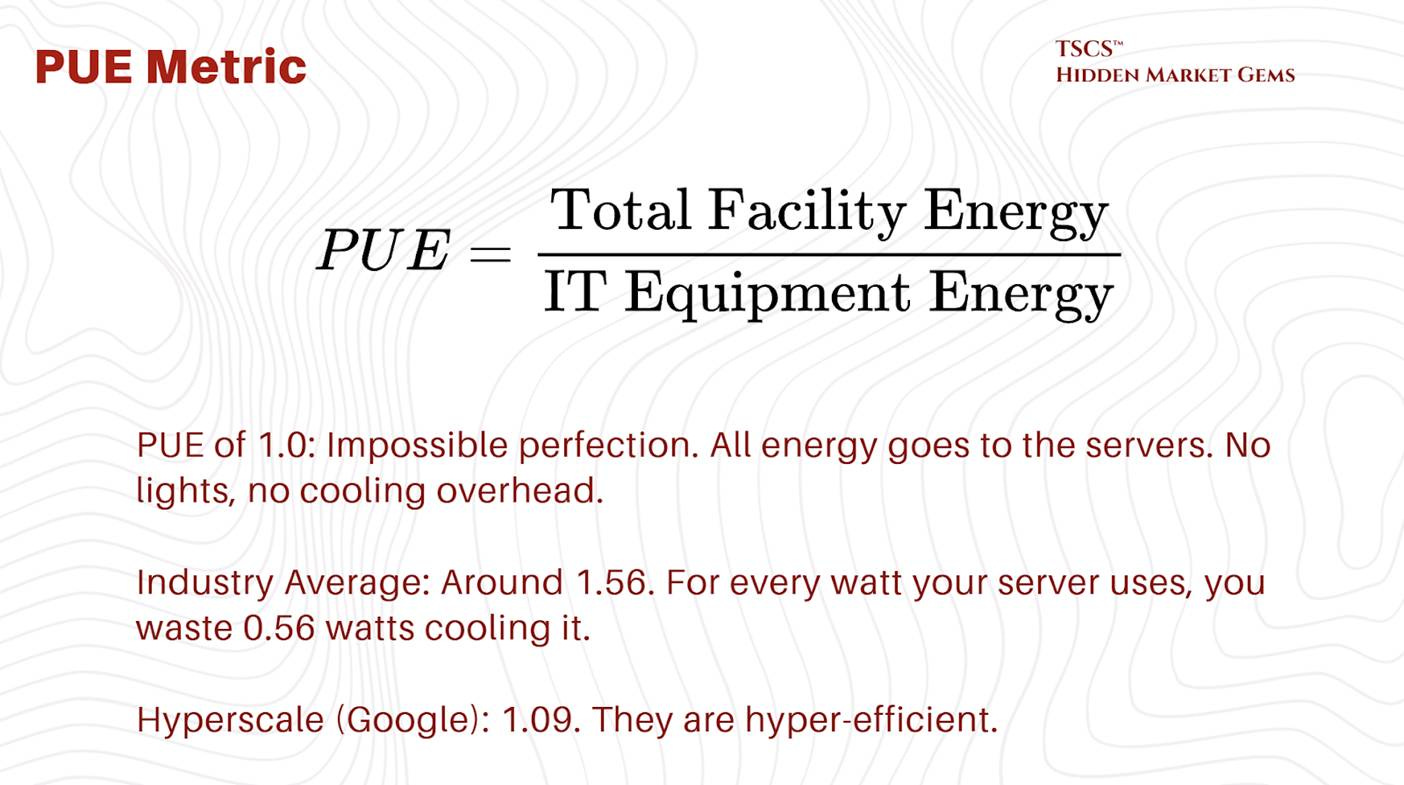
The Scam:
PUE is a “vanity metric” for many. It doesn’t measure water usage. You can get a great PUE by using evaporative cooling (swamp coolers), which uses very little electricity but drinks millions of gallons of water. You are essentially arbitraging the electric grid against the local aquifer. You look “Green” on energy (Low PUE) while draining the local river dry (High WUE - Water Usage Effectiveness).
1.5 Latency & Speed of Light
1.5.1 Speed of Light in Glass vs. Air
Now we get to the fun part: High-Frequency Trading (HFT) and the obsession with Latency.
Latency is the time it takes for a packet of data to travel from A to B. In a vacuum, light travels at approx 300,000 km/s (c).
But we don’t send data through a vacuum. We send it through fiber optic cables (glass) or through the air (microwave).
Fiber Optics: Standard telecom fiber has a group refractive index of about 1.47. That means light travels roughly 32% slower in fiber than in a vacuum (c/1.47).
Microwave: Air has a refractive index very close to 1.0 (approx 1.0003). Radio waves in air travel at roughly 99% the speed of light in a vacuum.
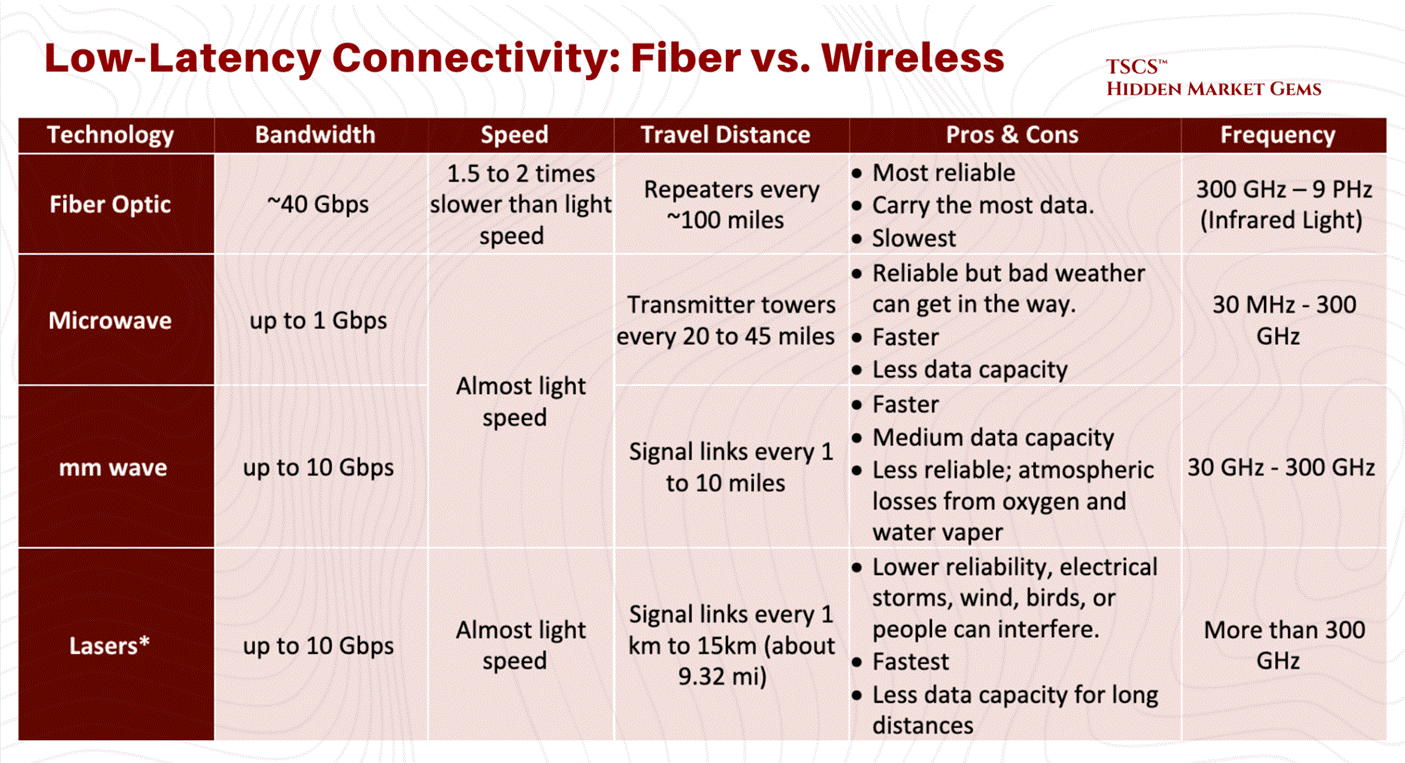
The Physics Arbitrage:
This means Microwave is faster than Fiber.
If you are a trader in Chicago (CME) trying to arbitrage a price difference against New York (NASDAQ/NYSE), and you use fiber, you lose. The guy using microwaves will see the price change, execute the trade, and steal your lunch money before your photon has even exited Pennsylvania.
Liberty speaks about the situations around these pysics in their post “604: Data Centers in Space, Hock Tan’s Coffee, Xiaomi vs Tesla, Nvidia vs China, Guy Gottfried & TerraVest, James Dyson, Boom Turbines, Base Power, and Comfort Films,” discussing latency plays (orbital data centers), and the physics constraints of heat rejection in a vacuum.
Module 2: The Physical Plant
TSCS’ Strategist Note: Think of the IT equipment (servers and software) as the “Brain” of the operation. The Physical Plant described below is the “Body”; the skeleton, heart, lungs, and immune system designed to keep that brain functioning 24/7/365.
2.1 Facility Layout & Structural Design
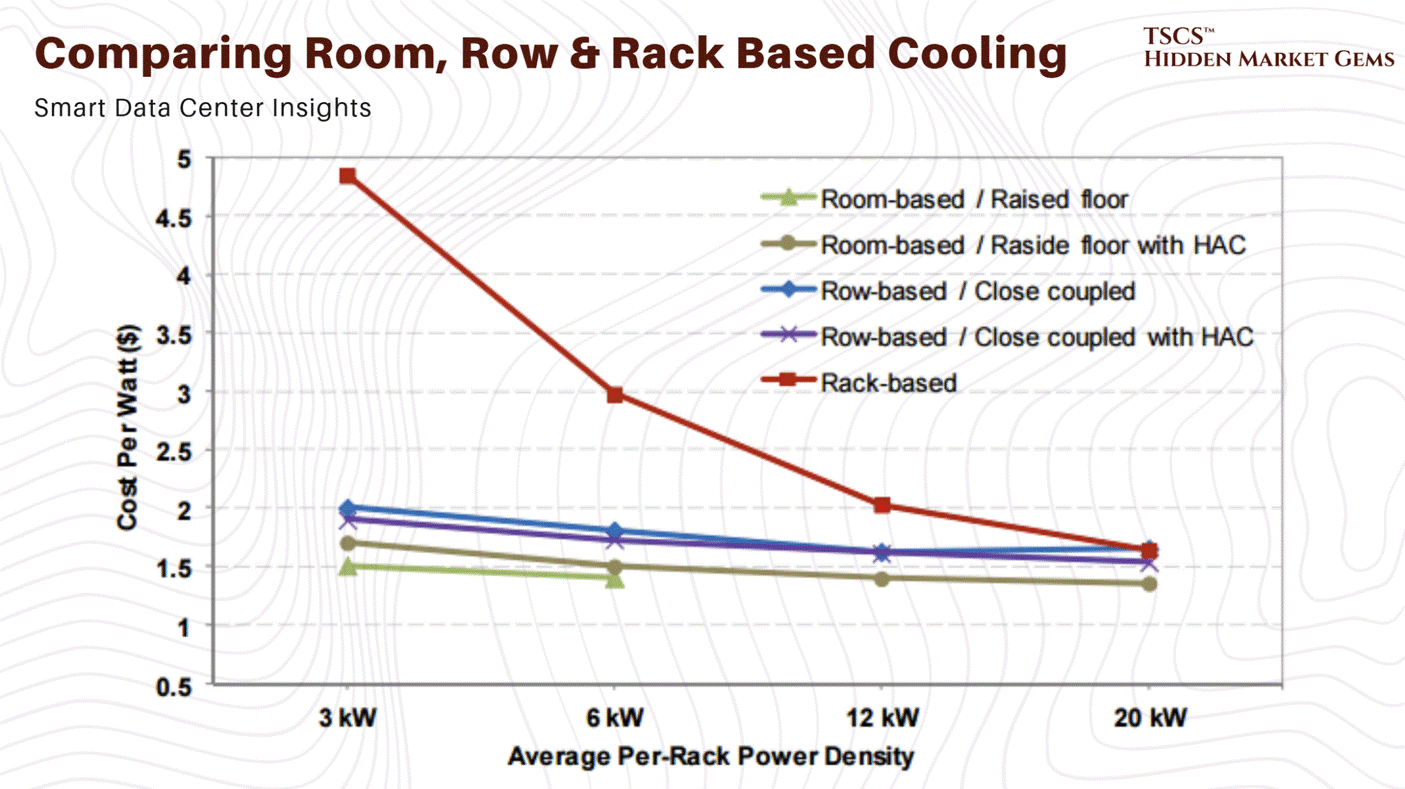
The physical design of a data center dictates its operational lifespan, efficiency, and adaptability. At the core of facility layout lies a decades-old debate regarding the foundation upon which the IT equipment rests: the floor.
2.1.1 Raised Floor vs. Slab-on-Grade
For nearly a quarter-century, the fundamental architectural decision in data center construction has been the choice of flooring system. This choice is not merely aesthetic; it dictates airflow strategies, cabling management, structural integrity, and long-term operational flexibility. The industry remains divided between the traditional Raised Floor model and the increasingly prevalent Slab-on-Grade design.
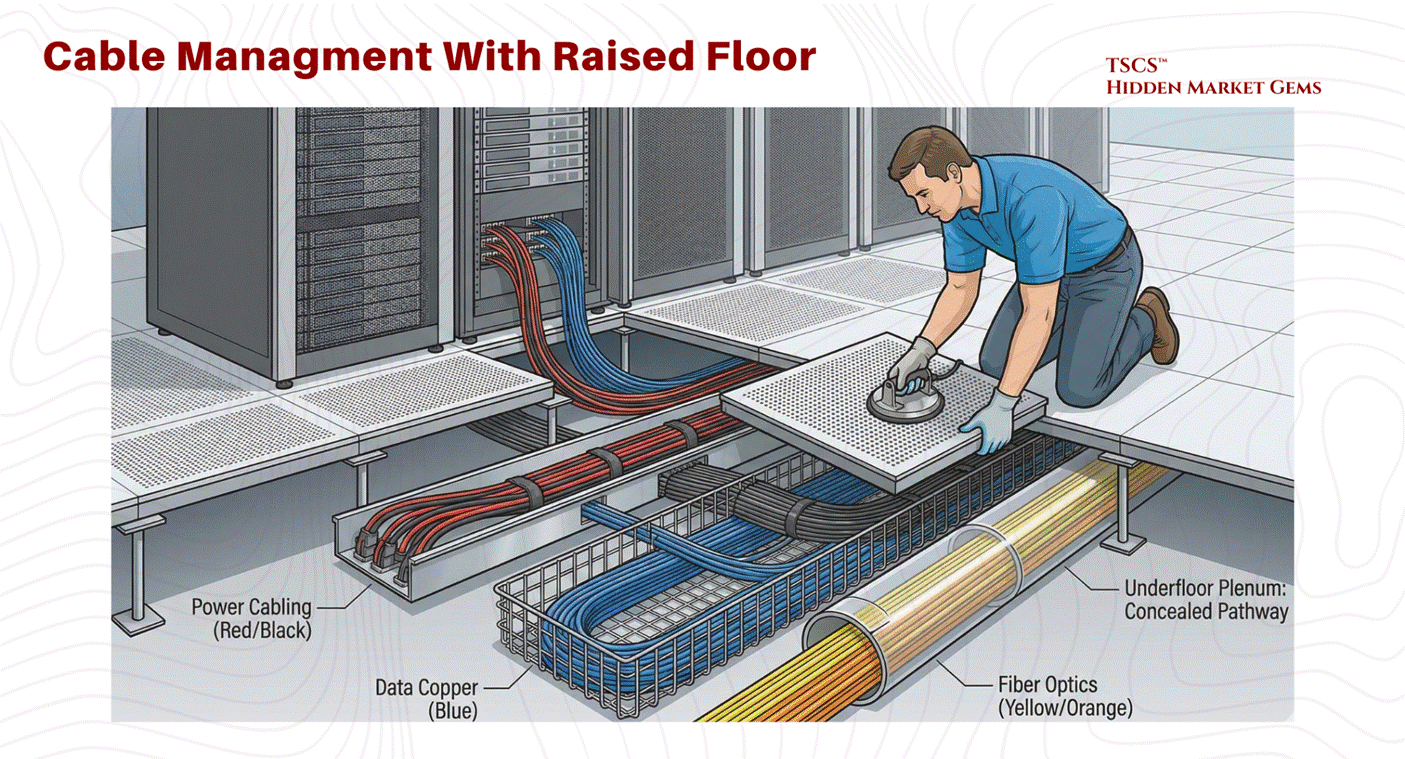
The raised floor, or access floor, has been the industry standard for legacy facilities and colocation centers. In this configuration, a grid of metal pedestals supports removable floor tiles, creating a plenum space beneath the IT equipment, typically ranging from 12 to 36 inches in height.
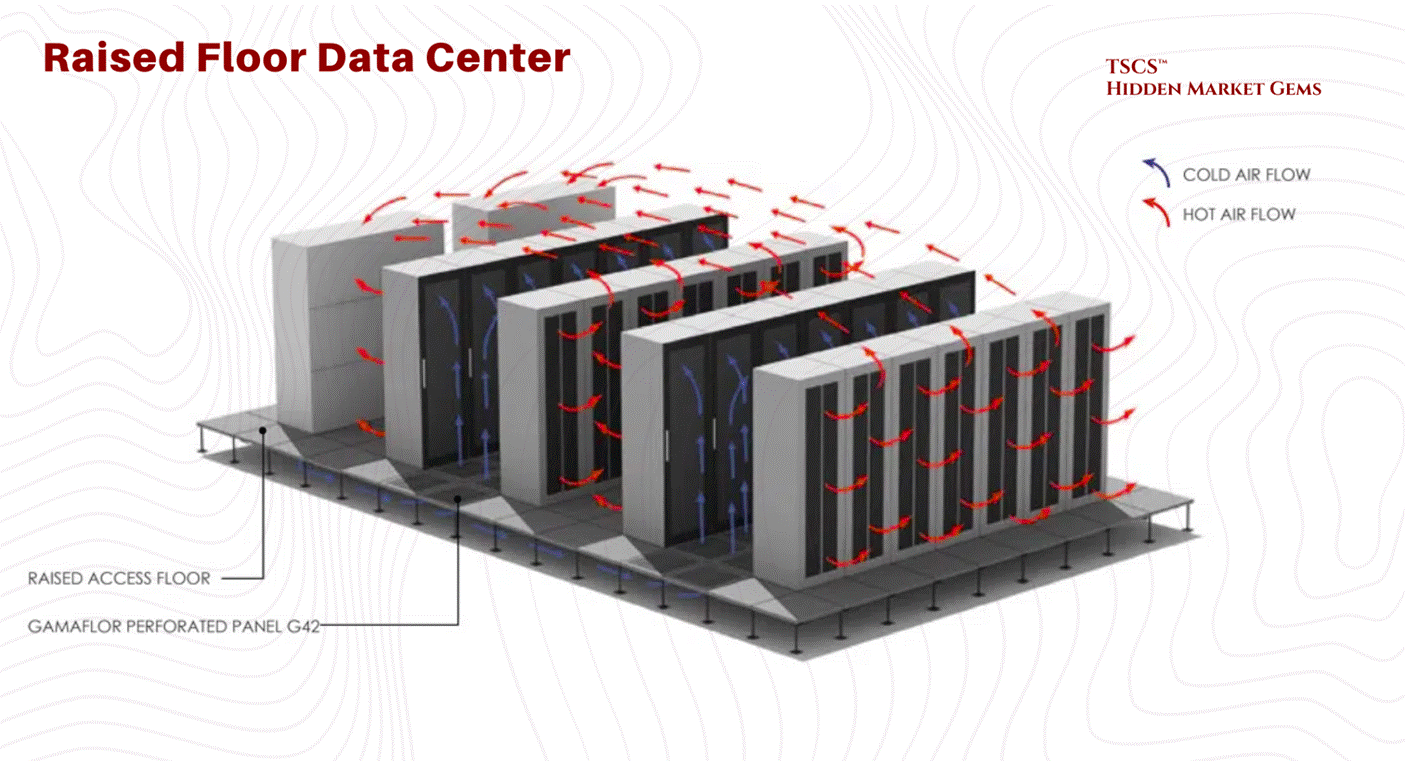
Operational Mechanism:
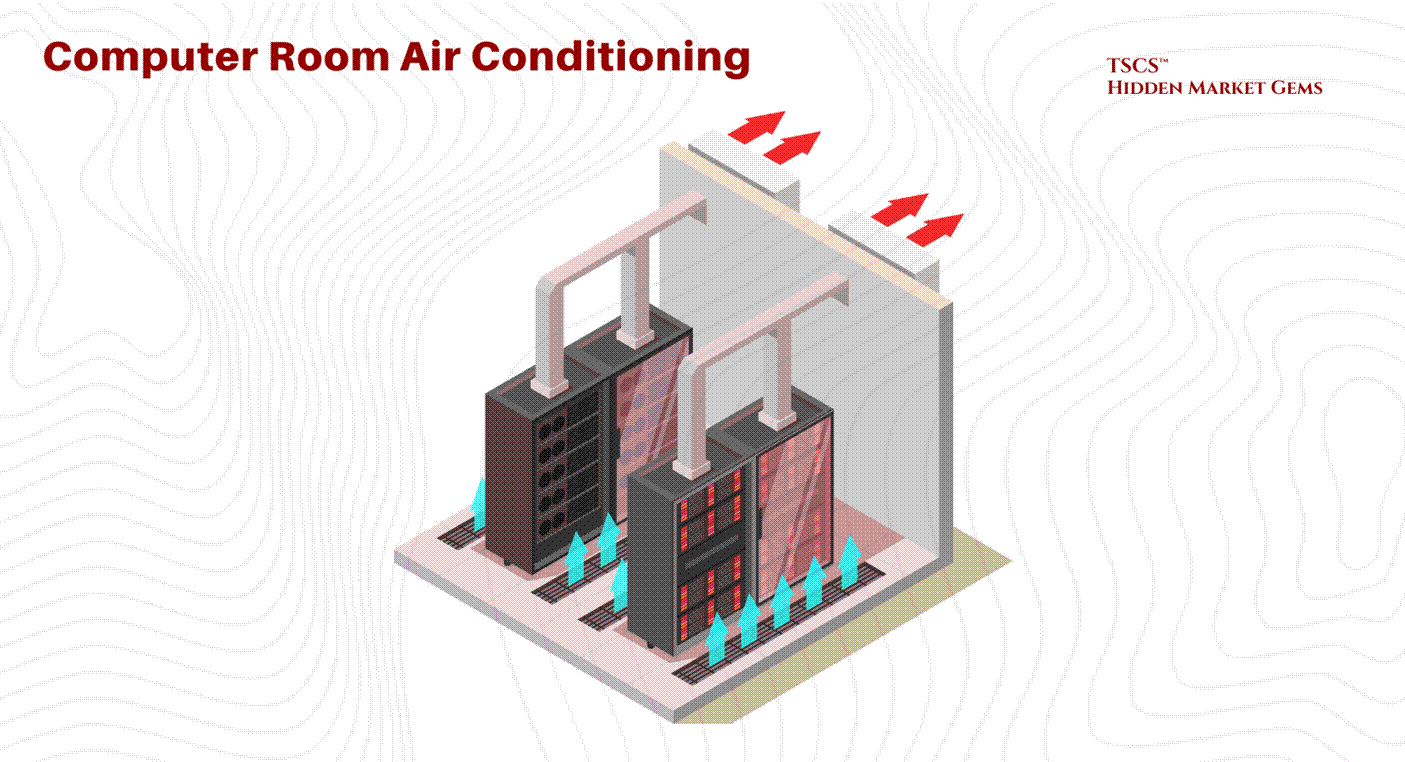
The primary utility of the raised floor is its function as a pressurized air distribution plenum. Conditioned air from Computer Room Air Conditioning (CRAC) units is pushed into this underfloor space. The plenum acts as a supply duct, delivering cold air through perforated tiles placed directly in front of server intakes. This separation of cold supply air (underfloor) from the hot return air (overhead) provides a foundational level of airflow management.
Cabling and Reconfiguration:
Beyond cooling, the plenum offers a concealed pathway for power cabling, data copper, and fiber optics. This allows for significant flexibility; facility managers can reconfigure rows, add new circuits, or upgrade connectivity by simply lifting tiles, a distinct advantage in dynamic colocation environments where tenant equipment is frequently cycled.
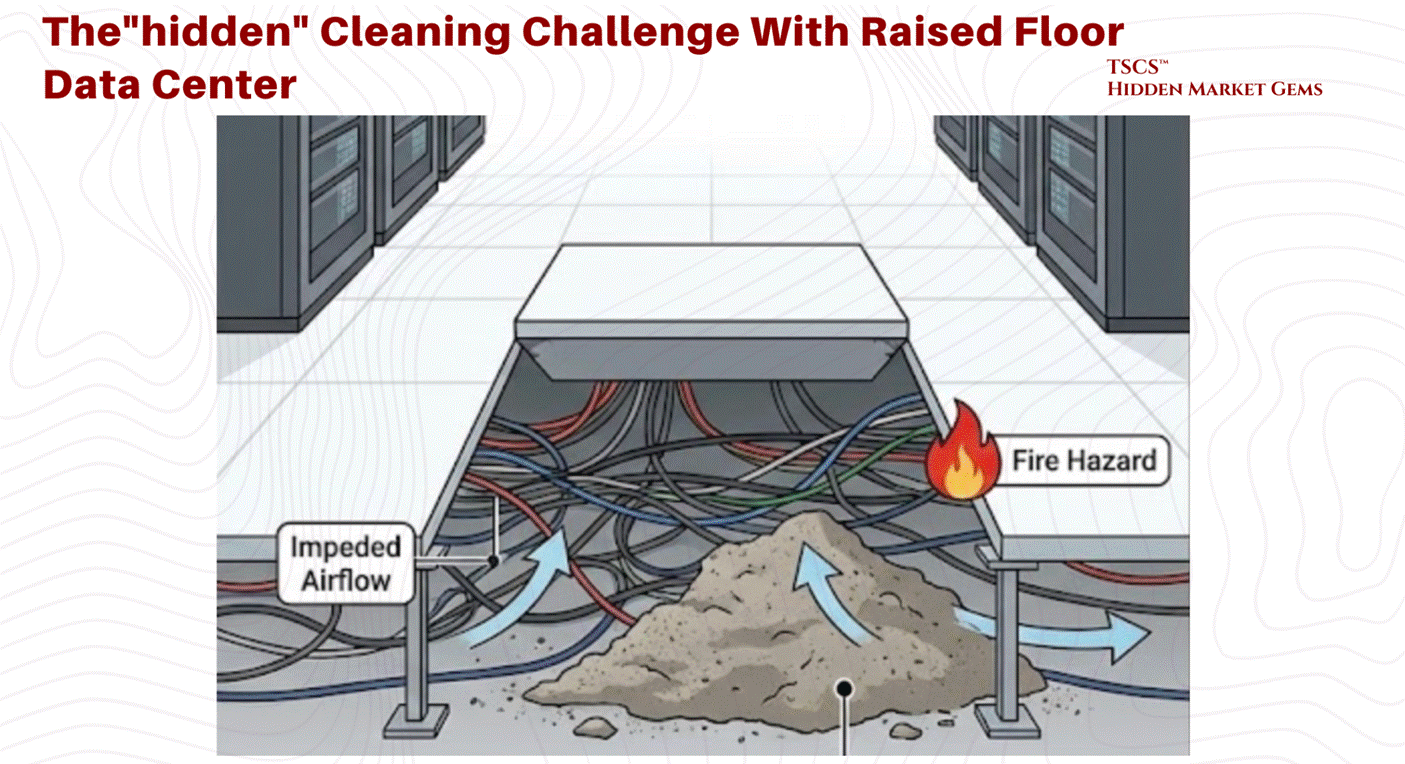
Cleanliness and Contamination Control:
From a janitorial perspective, the raised floor helps separate equipment from ground-level contaminants. However, it also introduces a “hidden” cleaning challenge. The plenum can become a repository for dust, debris, and abandoned cable, which can impede airflow and become a fire hazard. Specialized cleaning protocols are required to maintain the integrity of this underfloor space.
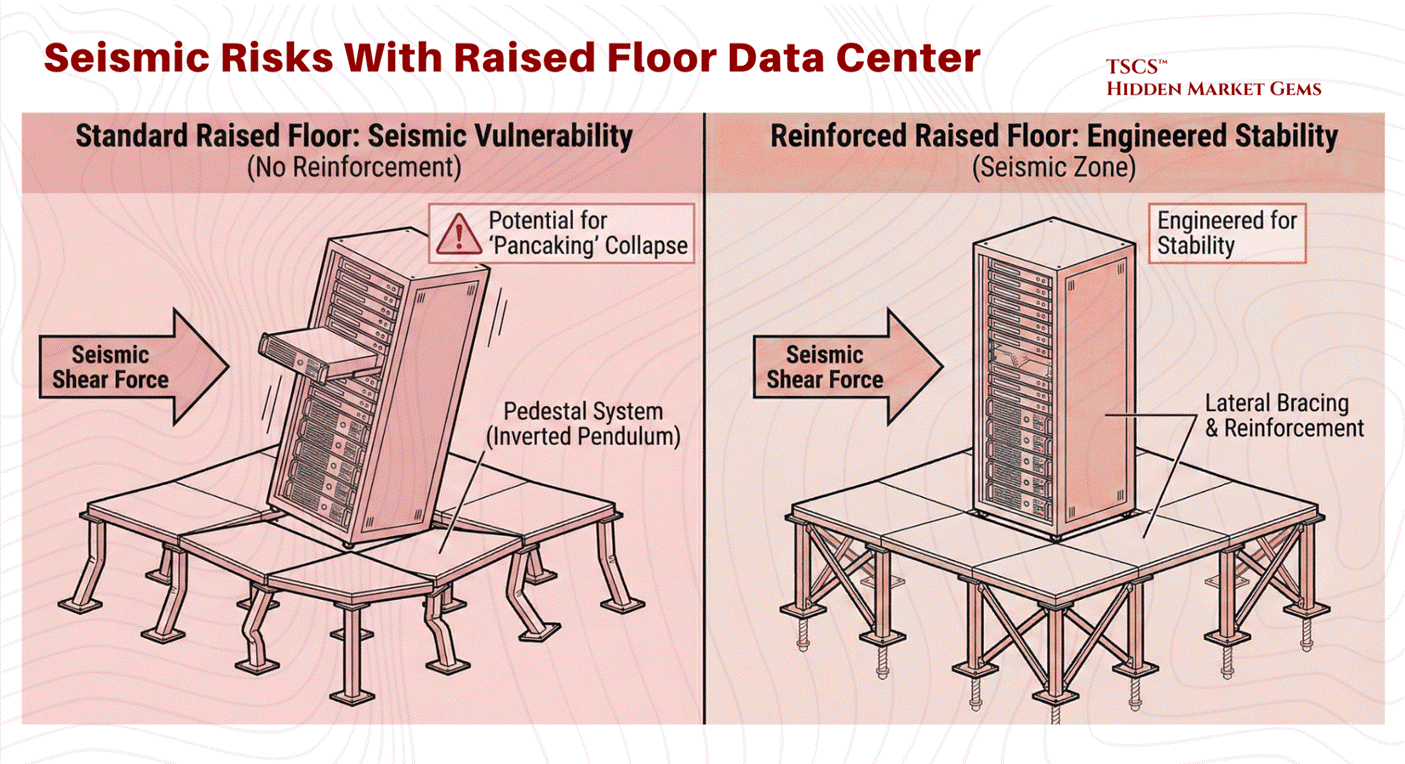
Seismic Vulnerabilities:
The raised floor introduces significant structural complexity, particularly in earthquake-prone regions. The pedestal system acts as an inverted pendulum. Without extensive lateral bracing and reinforcement, the shear forces of a seismic event can cause the pedestal legs to buckle. This potential for collapse (or “pancaking”) poses a catastrophic risk to the millions of dollars of hardware perched on top. Consequently, raised floors in seismic zones require costly engineering interventions to guarantee stability.
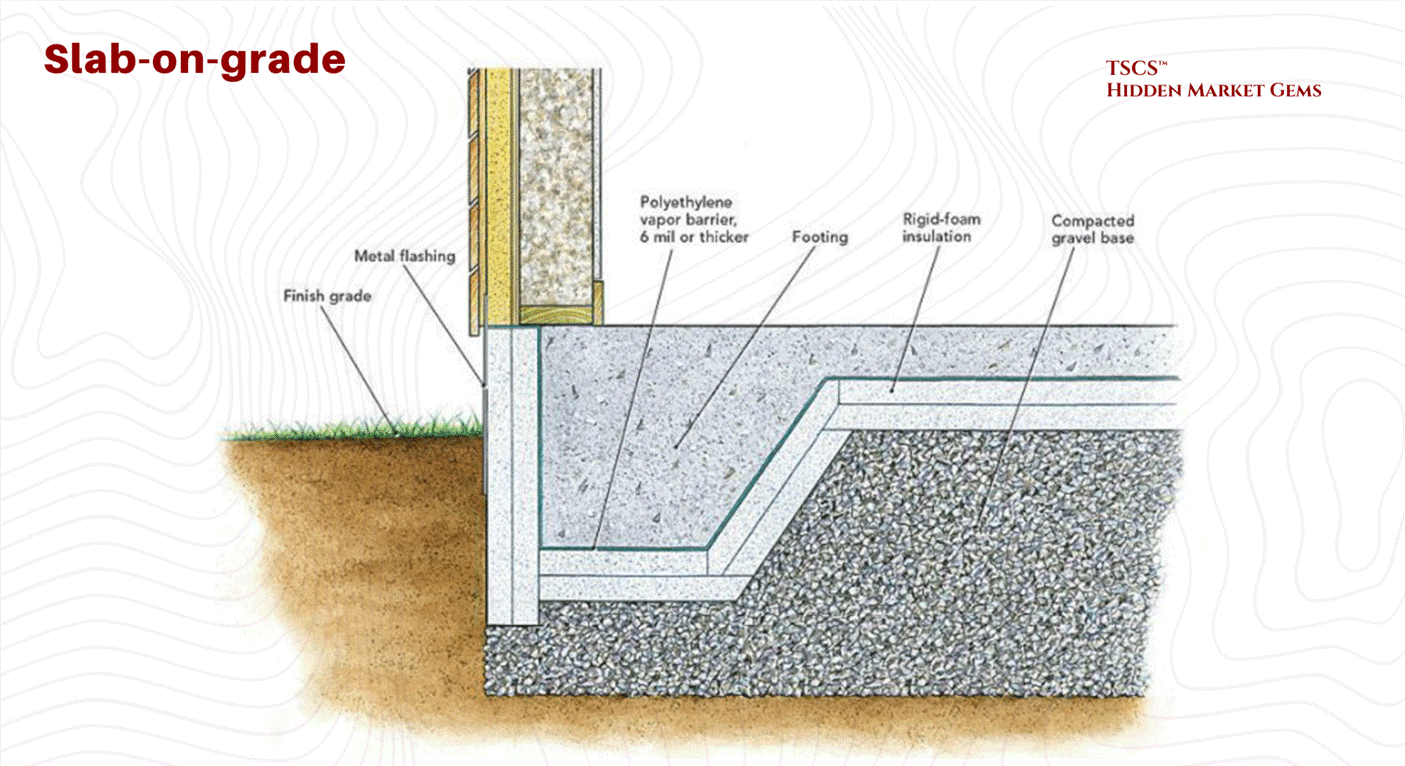
2.1.1b The Slab-on-Grade Architecture
Driven by the needs of hyperscalers and heavy industrial compute, the slab-on-grade design places racks directly on the concrete foundation.
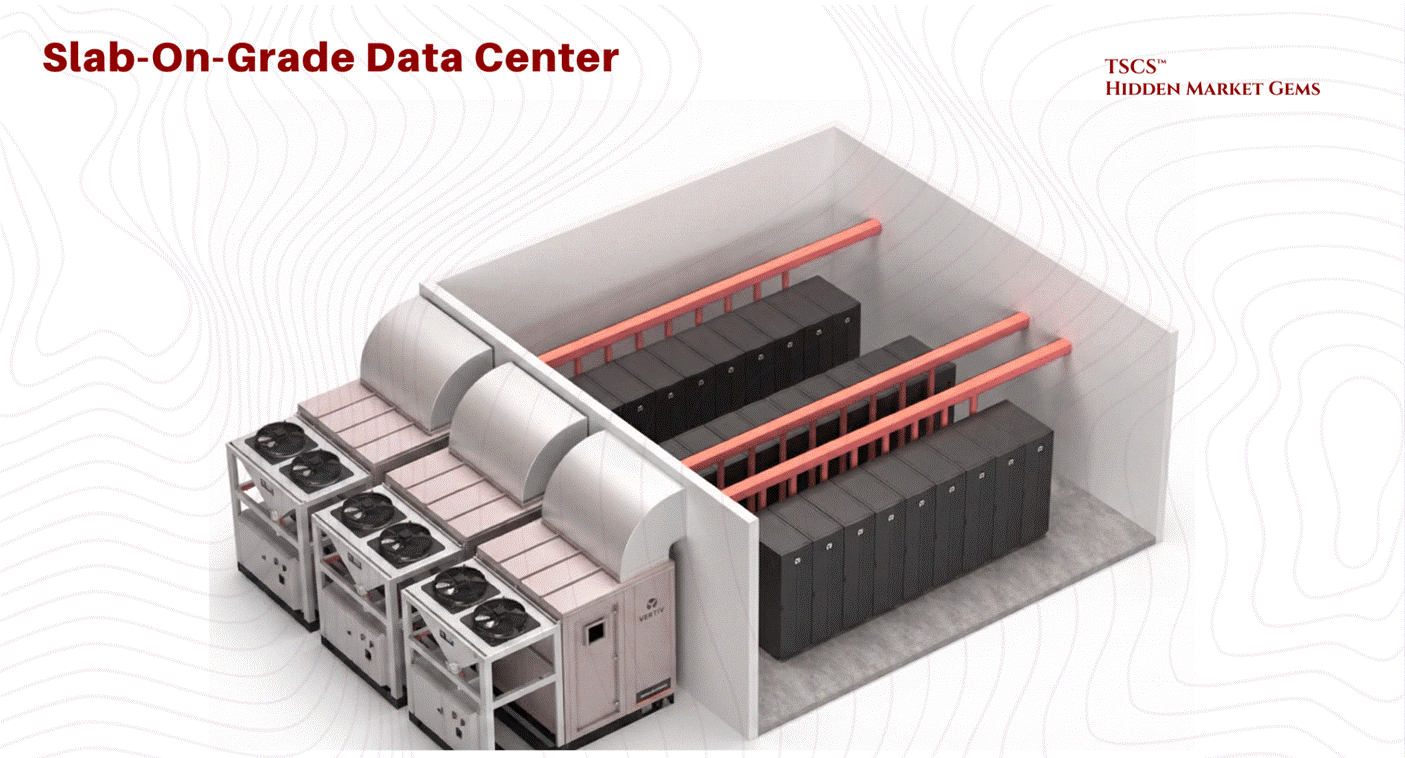
Structural Superiority for High Density:
The most distinct advantage of the slab floor is its load-bearing capacity and inherent stability. By anchoring equipment directly to the polished concrete slab, operators eliminate the risk of floor collapse. In seismic zones, this stability is guaranteed without the need for the complex lateral bracing required for raised floors. This is particularly critical for High Power Density (HPD) loads.
Equinix, for example, has built on slab-on-grade from its earliest facilities in 1998, and their SV5 facility in Silicon Valley validated the approach under heavy blade servers and high-performance platforms like the Sun Fire UltraSPARC, which would have taxed the limits of traditional raised floor loading capacities. This was not a "shift" for Equinix; it was confirmation that their founding design philosophy was right all along.
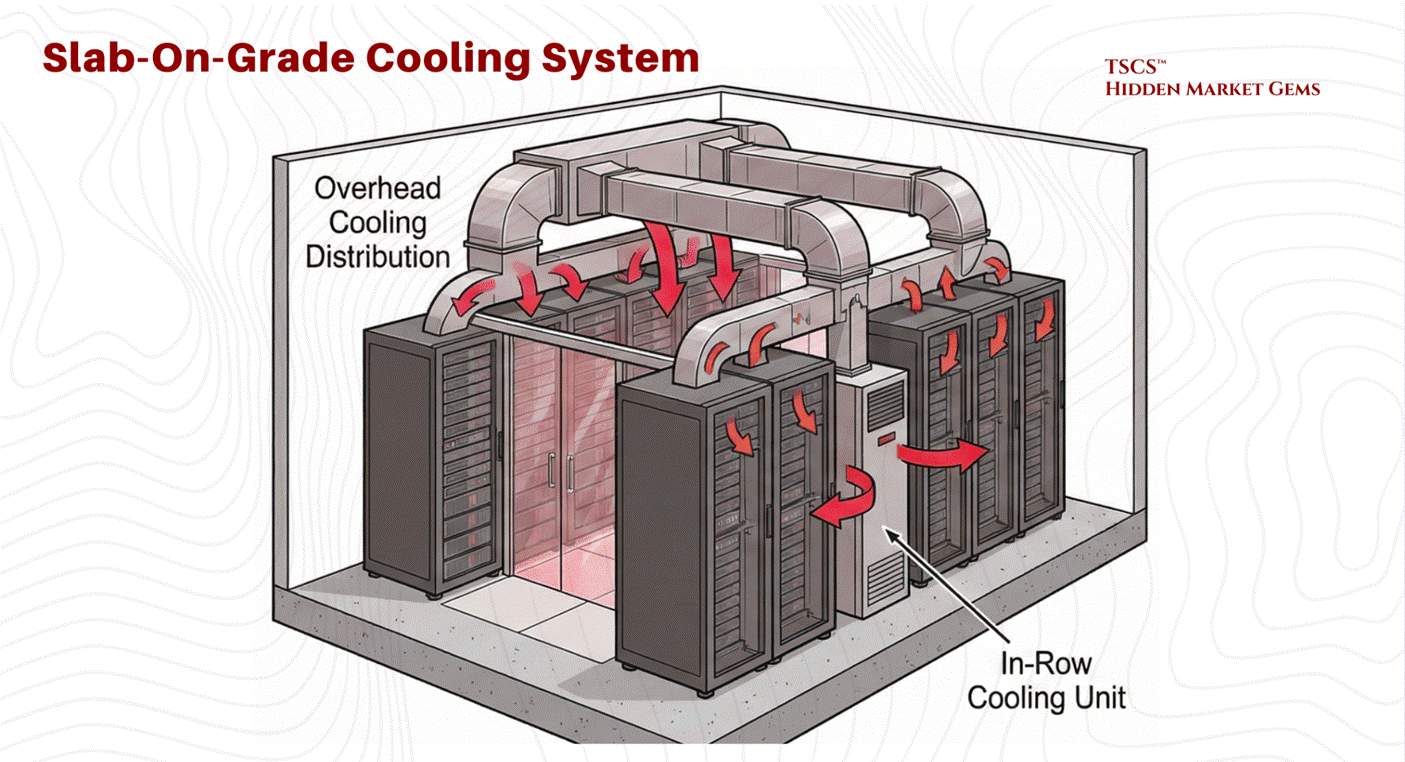
Modern Cooling Integration:
Slab floors necessitate overhead cooling distribution (ductwork) or in-row cooling units, as there is no underfloor plenum. While early critics argued this was less efficient, modern operational data has shown that the energy consumption difference between overhead ducts (slab) and underfloor plenums (raised) is design-dependent rather than architecture-dependent. Research by Sorell et al. found overhead systems can be more energy-efficient in many typical configurations, while underfloor advocates point to advantages in extended free-cooling periods and fan energy savings.
The honest answer: competent airflow management matters more than whether the air comes from above or below. In practice, slab floors eliminate the risk of underfloor air leakage, a common source of inefficiency in raised floor environments where conditioned air escapes through cable cutouts or poorly sealed tiles.
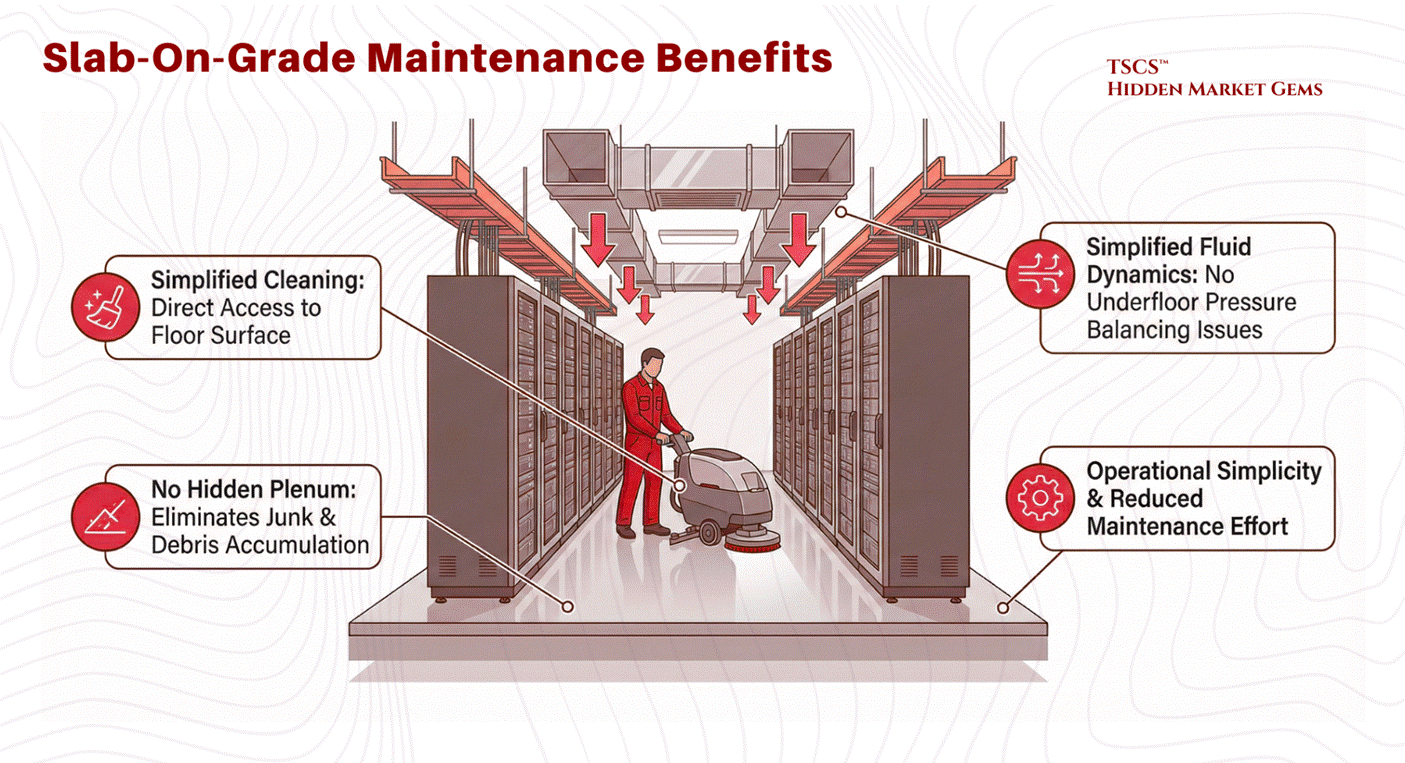
Cost and Maintenance:
While often cited as a cost-saving measure due to the elimination of pedestals and tiles, recent analysis suggests the construction cost difference per square foot between raised and slab floors is negligible. The true cost advantage lies in maintenance and simplicity. Slab floors are easier to clean, have no hidden plenums to accumulate junk, and eliminate the complex fluid dynamics issues associated with underfloor air pressure balancing.
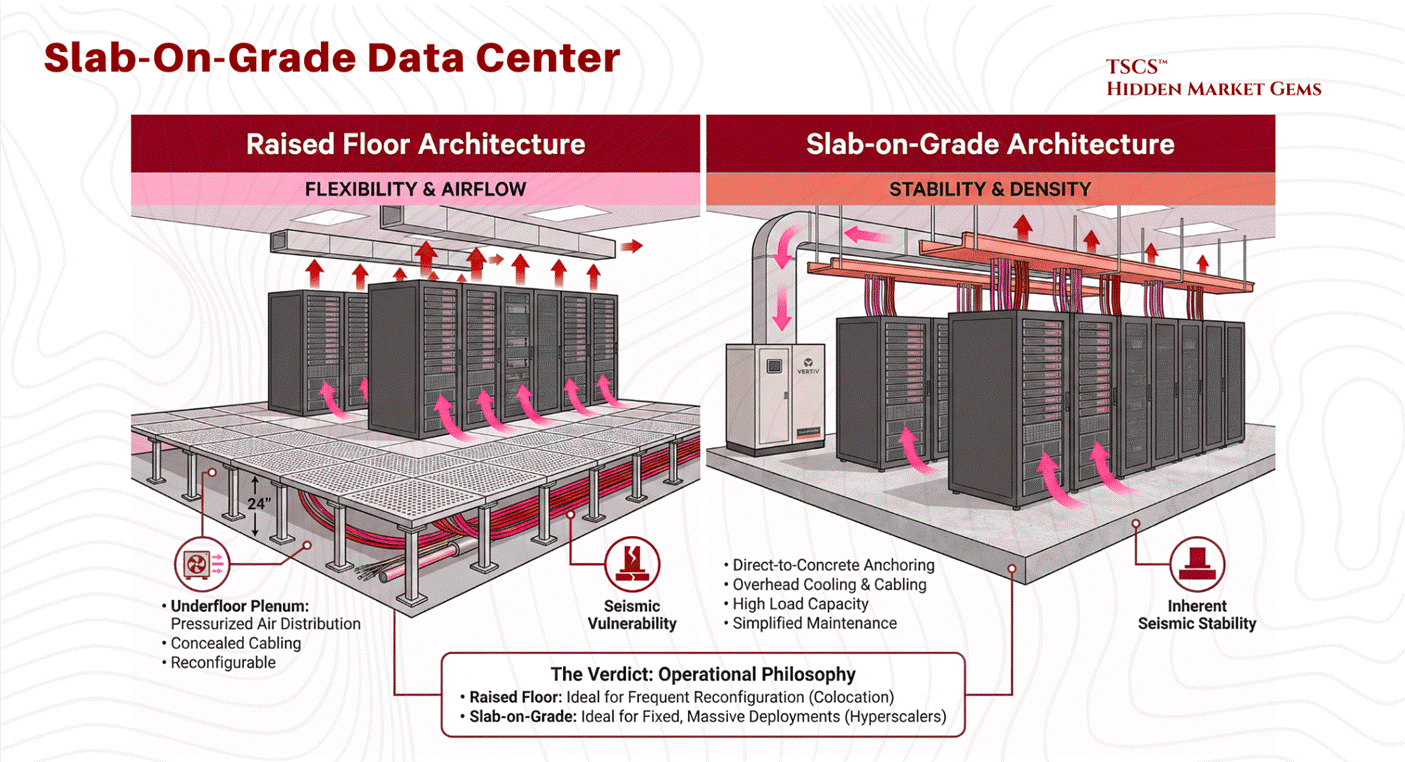
The Verdict: Operational Philosophy
The decision between these two architectures is rarely about superior physics alone but rather operational philosophy. Raised floors offer flexibility for frequent reconfiguration, making them popular in colocation facilities where tenant needs change rapidly and cable management requirements fluctuate. Slab floors offer robustness and simplicity, favored by hyperscalers with fixed, massive deployments where the equipment is unlikely to move once installed. As noted in industry analysis, while ease of maintenance and lower costs favor slab floors, the “prevailing demand” often leans toward raised floors due to industry inertia and the established supply chain.
Dylan Patel, Myron Xie, Daniel Nishball, and 9 other incredible writers made a nice post called "TPUv7: Google Takes a Swing at the King” which (while focused on chips) covers the rack-level plumbing, optical interconnects, and physical density requirements of modern “AI Factories.”
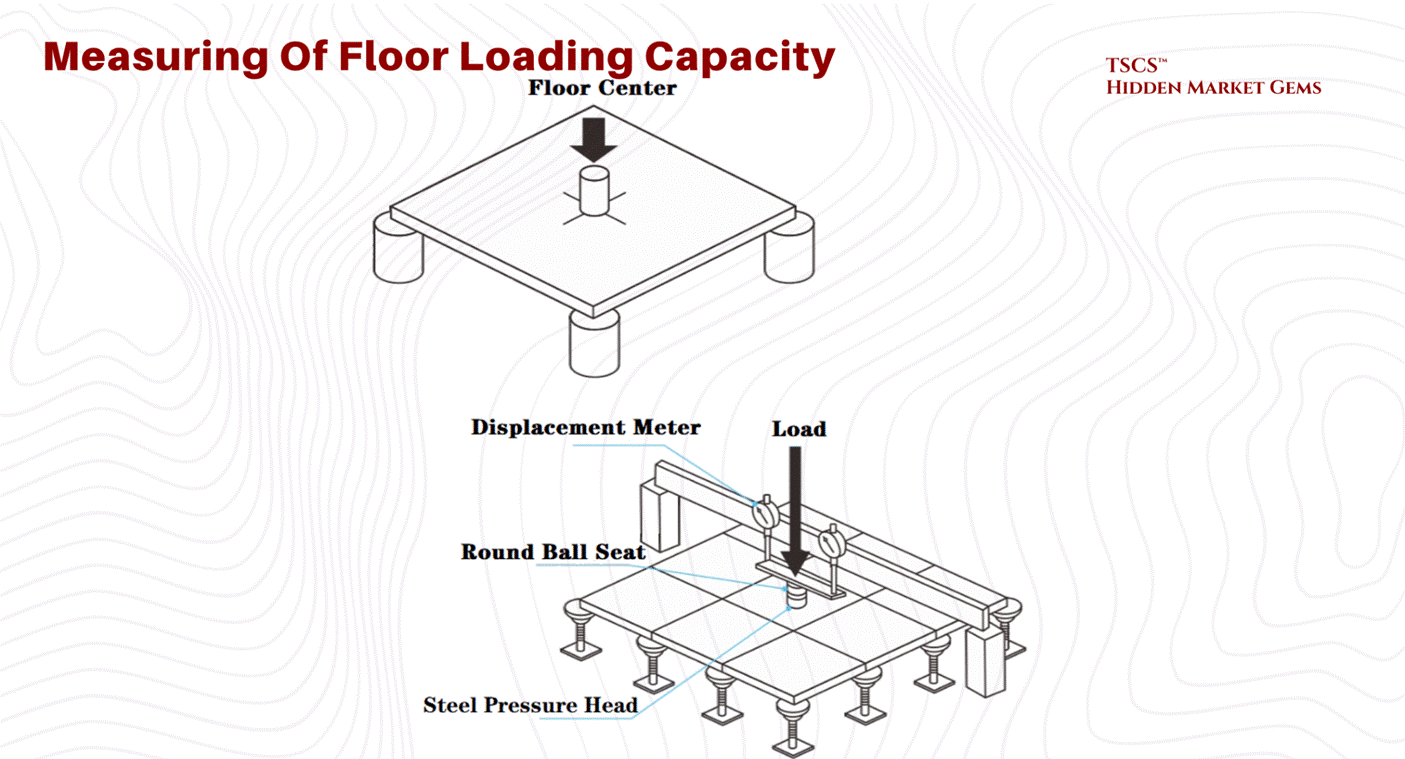
2.1.2 Structural Loading Physics
As server density increases, particularly with the advent of AI hardware, the sheer physical weight of the equipment becomes a critical design constraint. A standard data center cabinet footprint is approximately 7.0 to 8.0 square feet for a 42U rack (24" x 42" to 24" x 48"), though effective footprints including clearance can push toward 8.8 square feet.
Floor Loading Capacity (PSF):
Engineers measure a floor’s ability to support this weight in Pounds Per Square Foot (PSF).
The Calculation: A 3,000 lb cabinet on an 8.0 sq ft footprint exerts a point load of roughly 375 PSF directly under the cabinet. However, structural engineers typically average floor loading across the aisle space and the entire room.
The Reality Gap: To put this in perspective, most commercial office buildings have floor ratings of 50–100 PSF, roughly equivalent to a “library filled with stacks of books”. This is woefully insufficient for modern data centers. A floor caving in is a catastrophic failure mode that cannot be mitigated by software.
The Weight Escalation: Traditional IT hardware pushes cabinets to 2,500 to 3,000 pounds. But AI is rewriting the load tables. GPU-dense racks with liquid cooling infrastructure now regularly exceed 4,000 pounds, with vendors like Eaton offering rack enclosures rated to 5,000 lbs static load. This is not a marginal increase. It is a structural regime change that is forcing facility engineers to rethink foundations, not just airflow.
Industry Benchmarks (Historical Context): A useful reference point comes from Digital Realty's legacy Telx portfolio (circa 2014, covering 20 facilities and 1.3 million square feet). These figures illustrate the range of what was considered adequate before the AI era:
Average Capacity: Digital Realty’s portfolio averages 178 PSF.
Standard Facility: The ATL1 facility in Atlanta represents the median at 185 PSF.
High-Density Facility: The NJR3 facility in Clifton, New Jersey, built from the ground up, boasts a massive 400 PSF capacity. This 400 PSF rating is necessary to support the “heaviest of hardware,” such as fully populated storage arrays and liquid-cooled AI racks, without the risk of structural failure.
Today, with AI racks pushing well beyond the weight assumptions of a decade ago, 400 PSF is no longer exceptional. It is the floor (pun intended) for any facility serious about hosting next-generation compute
2.1.3 Fluid Dynamics (Venturi Effect)
In a raised floor environment, the space beneath the tiles (the plenum) is designed to act as a high-pressure vessel. The operational goal is for static pressure to push cool air up through perforated tiles into the cold aisle. However, fluid dynamics, specifically Bernoulli’s Principle, can subvert this intent through the Venturi Effect.
The Physics of Failure:
Bernoulli’s Principle dictates that for an incompressible fluid (like air at low speeds), an increase in velocity results in a decrease in static pressure.

In a data center plenum, CRAC units blast air into the underfloor space at high velocities. Industry vendor data (notably from Alfa Laval) benchmarks problematic velocities at above approximately 16.5 ft/s, though the exact threshold depends on plenum geometry.
High Velocity Zones: Near the CRAC units or in narrow plenum sections, air velocity is highest.
Pressure Drop: According to Bernoulli, this high velocity creates a zone of low static pressure.
The Reverse Flow Phenomenon: If this static pressure drops below the ambient room pressure (the pressure above the floor), the perforated tiles in that zone will not deliver cool air. Instead, the Venturi Effect will actively suck warm room air down into the plenum.
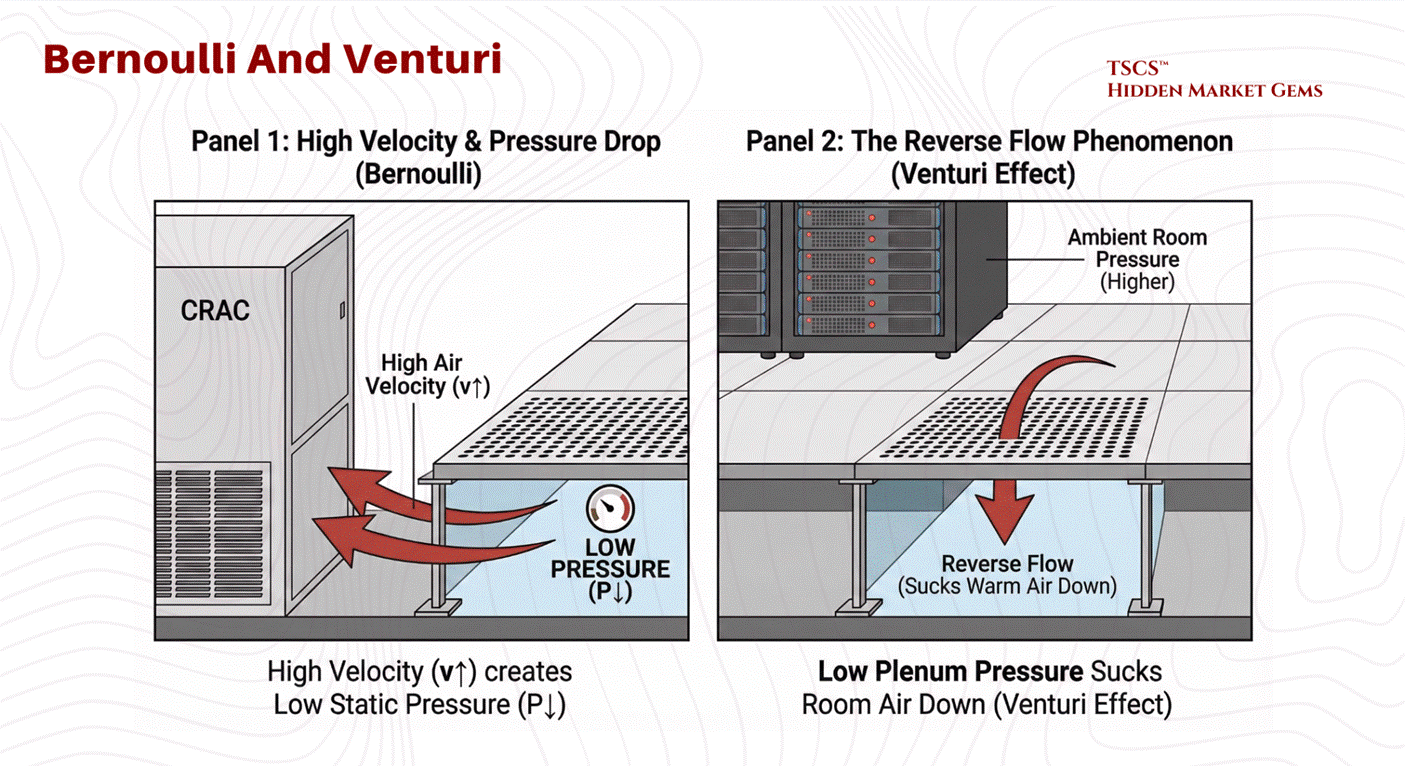
Consequences:
This mixing of warm room air with the cold supply air in the plenum dilutes the cooling capacity before it even reaches the servers further down the row. This results in “hot spots” and creates a scenario where the IT equipment is starved of cooling despite the CRAC units running at full power. To mitigate this, airflow modeling using Computational Fluid Dynamics (CFD), which solves the Navier-Stokes equations across the full three-dimensional plenum geometry, is essential to determine the optimal floor height and tile placement. A higher floor (e.g., 36 inches vs 12 inches) reduces air velocity by increasing the cross-sectional area, thereby maintaining uniform static pressure and ensuring adequate delivery to every rack.
2.2 Power Infrastructure
If the facility layout is the body of the data center, the power infrastructure is its nervous system. The goal of this system is not just to deliver electricity, but to refine it, taking the raw, noisy, and potentially unreliable power from the utility grid and converting it into a pristine, uninterrupted stream for sensitive IT equipment.
2.2.1 UPS Systems (Double Conversion)
The Uninterruptible Power Supply (UPS) is the heartbeat of the data center, ensuring that power remains consistent despite grid fluctuations. While various topologies exist, the industry “gold standard” for critical loads is the Online Double-Conversion UPS.
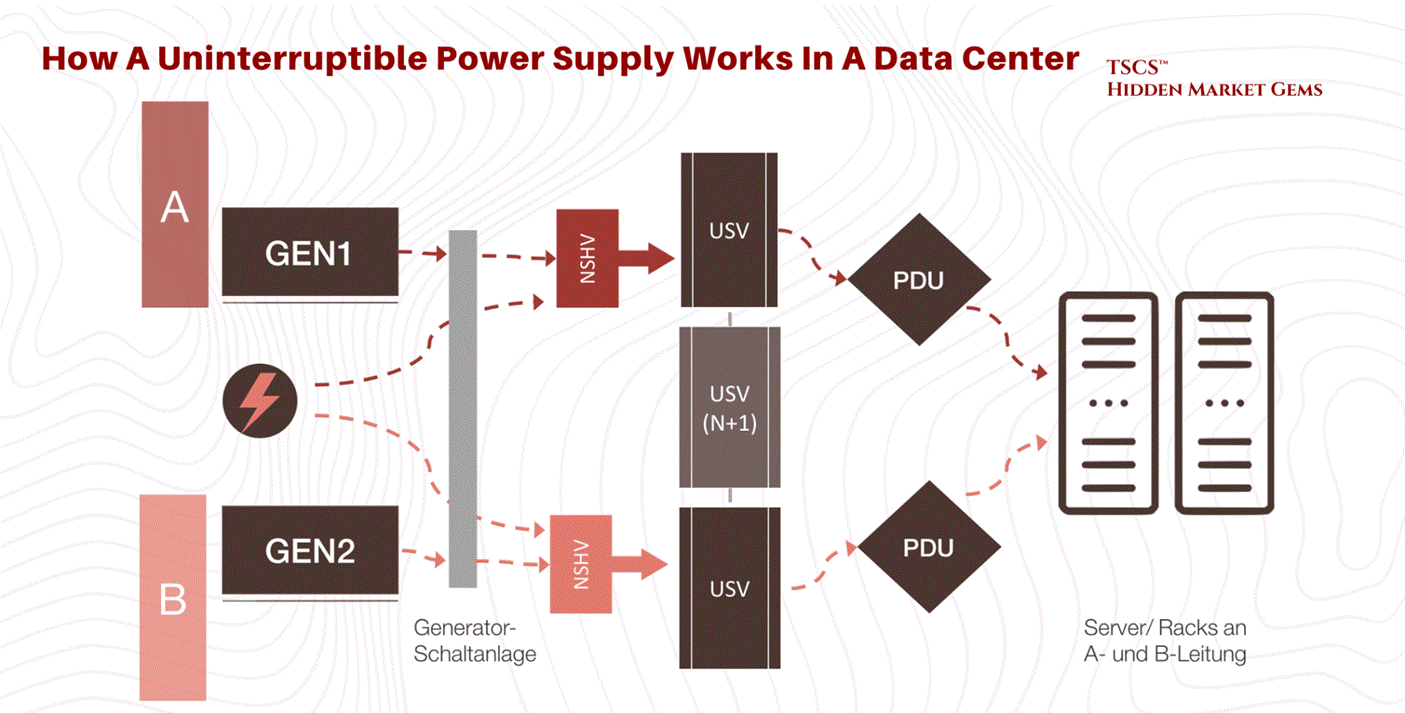
Mechanism of Double Conversion:
This topology completely isolates the IT load from the raw utility power, creating a “firewall” for electricity.
Rectifier (AC to DC): Raw AC power from the grid enters the rectifier. Here, it is converted to Direct Current (DC). This stage also performs Power Factor Correction, improving the efficiency of the power draw and reducing the electrical load on the building’s infrastructure.
Battery Charging: The DC bus charges the battery bank, ensuring energy is stored for immediate release during a failure. The batteries act as a chemical capacitor, smoothing out minor fluctuations.
Inverter (DC to AC): The DC power is then inverted back into precise, clean AC sine-wave power. This regenerated AC is what feeds the servers. Because the output is generated locally by the inverter, it is free of the frequency drifts, sags, and surges present on the utility line.
Static Bypass: In the event of a UPS internal fault (e.g., inverter failure or overload), a high-speed bypass switch automatically transfers the load back to utility power to prevent a drop.
2.2.2 Transformers (Delta-Wye)
Distributing power throughout a facility requires stepping down voltages (e.g., from 480V distribution levels to 208V/120V utilization levels). The standard device for this application is the Delta-Wye (Delta-Star) Transformer.
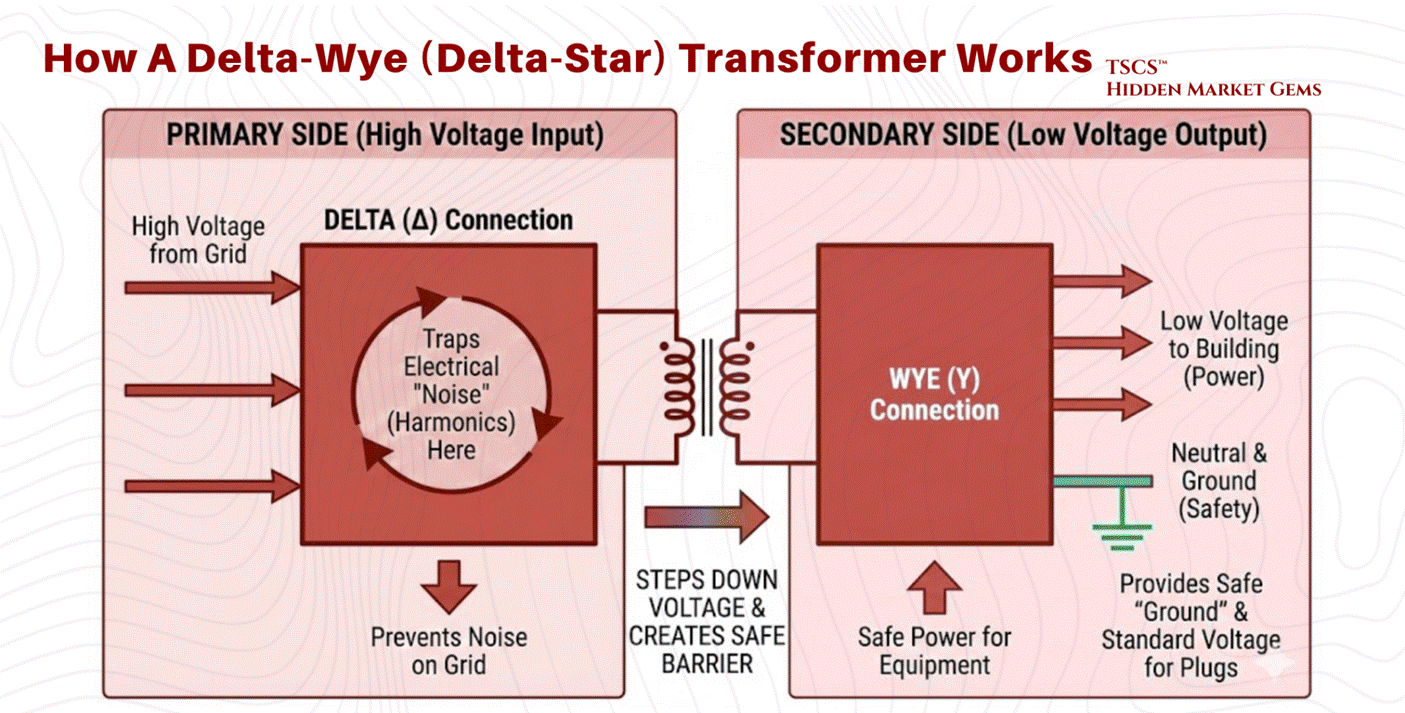
Physics of the Configuration:
Primary Side (Delta): The input windings are connected in a triangle configuration with three wires (phases) and no neutral. This side connects to the high-voltage input.
Secondary Side (Wye): The output windings are connected in a star configuration with four wires, three phases plus a central Neutral point.
Why Delta-Wye is Critical:
The Delta-Wye configuration is not arbitrary; it is a specific engineering solution to the problems caused by modern IT equipment.
Harmonic Mitigation and Trapping: IT equipment constitutes a “non-linear load,” which draws current in pulses rather than a smooth sine wave. This generates "triplen" harmonics (3rd, 9th, 15th, 21st orders). These harmonic currents can cause severe overheating in neutral conductors. The Delta primary winding physically traps these zero-sequence currents. At triplen harmonic frequencies, the three phases align, producing currents that sum to zero at node points. The geometry of the Delta connection allows these harmonic currents to circulate harmlessly within the closed loop of the triangle, preventing them from reflecting back onto the utility grid.
Grounding Reference: The Wye secondary provides a stable neutral point that can be grounded. This is essential for safety and for providing the 120V (phase-to-neutral) power required by standard North American plugs.
Isolation: The physical separation of the primary and secondary windings provides galvanic isolation, helping to filter electrical noise and block high-frequency transients from passing through to the load.
2.2.3 Generator Synchronization (OOPS Physics)
When utility power fails, backup generators must come online to support the load. Bringing a massive rotating generator onto a live bus (or paralleling it with another generator) requires precise synchronization. Failure to do so results in Out-of-Phase Synchronization (sometimes colloquially called "OOPS" in the industry, though this is not a formal IEEE term), a catastrophic event.
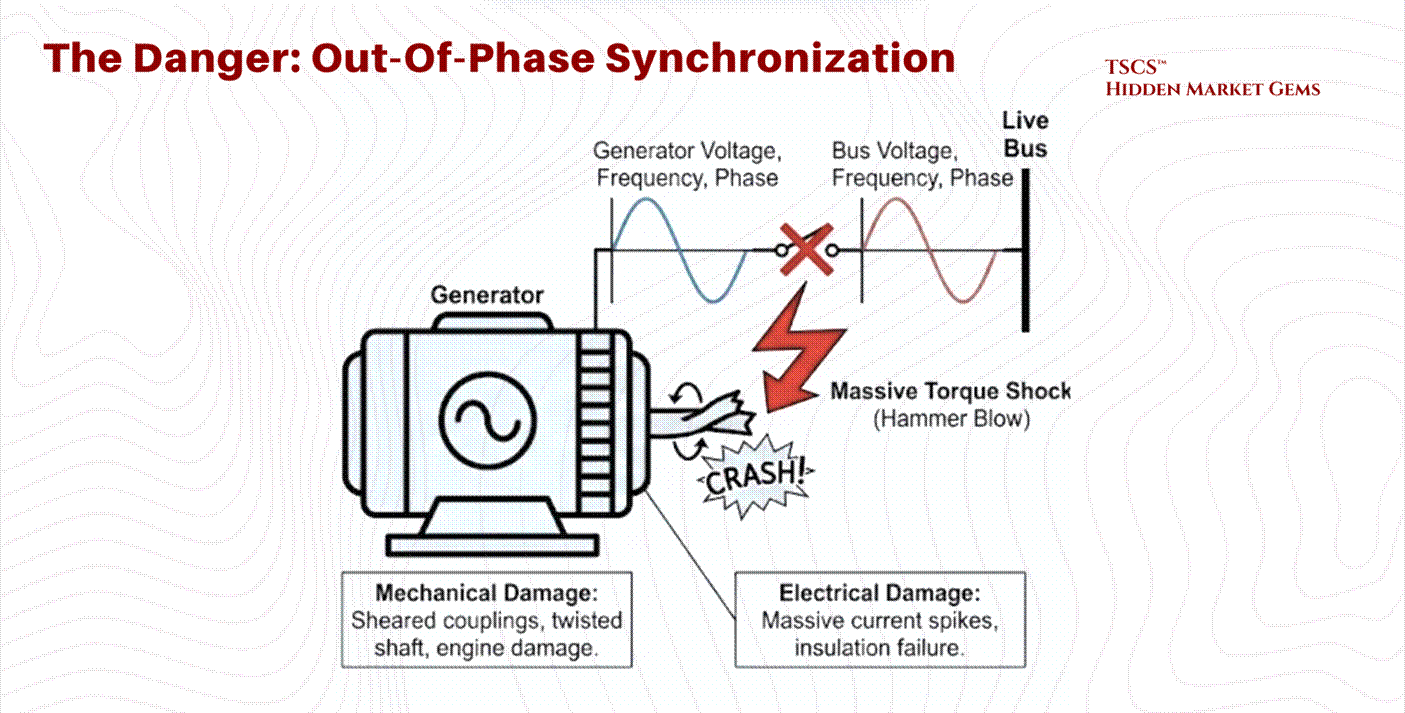
The Physics of Torque Shock:
Synchronization requires matching three variables between the generator and the bus: Voltage, Frequency, and Phase Angle.
If a generator is connected while 180 degrees out of phase, the magnetic poles of the rotor are directly opposing the rotating magnetic field of the stator. This creates an instantaneous, massive transient torque.
Mechanical Damage: This torque shock acts like a “hammer blow” to the generator shaft. It can shear couplings, twist the steel shaft, or cause catastrophic damage to the prime mover (diesel engine).
Electrical Damage: The stator windings experience massive current spikes as the machine attempts to force itself into sync, leading to thermal stress and insulation failure.
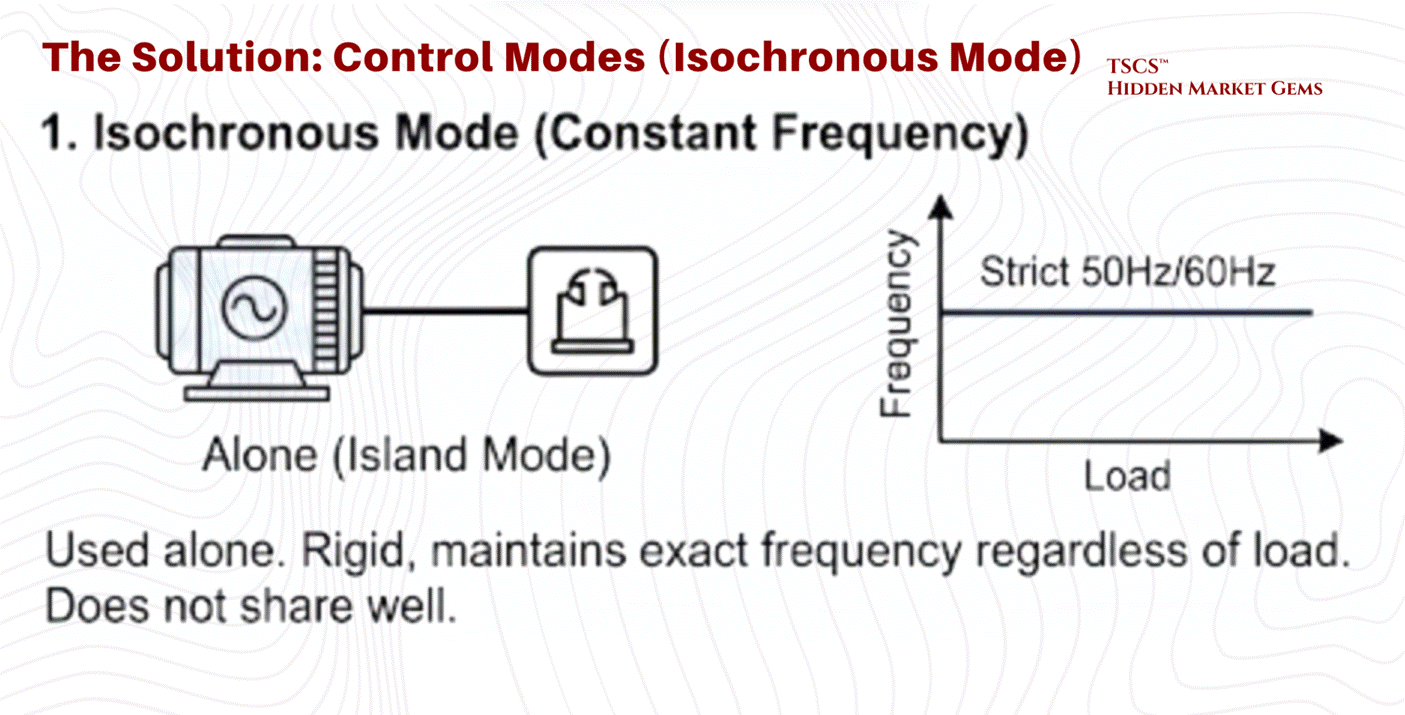
Control Modes: Isochronous vs. Droop:
Once synchronized, the generator’s governor controls its behavior using one of two modes:
Isochronous Mode (Constant Frequency): This is used when the generator is operating alone (Island Mode). It maintains a strict 50Hz or 60Hz frequency regardless of load changes. It is rigid and responsive but does not share load well with other sources.
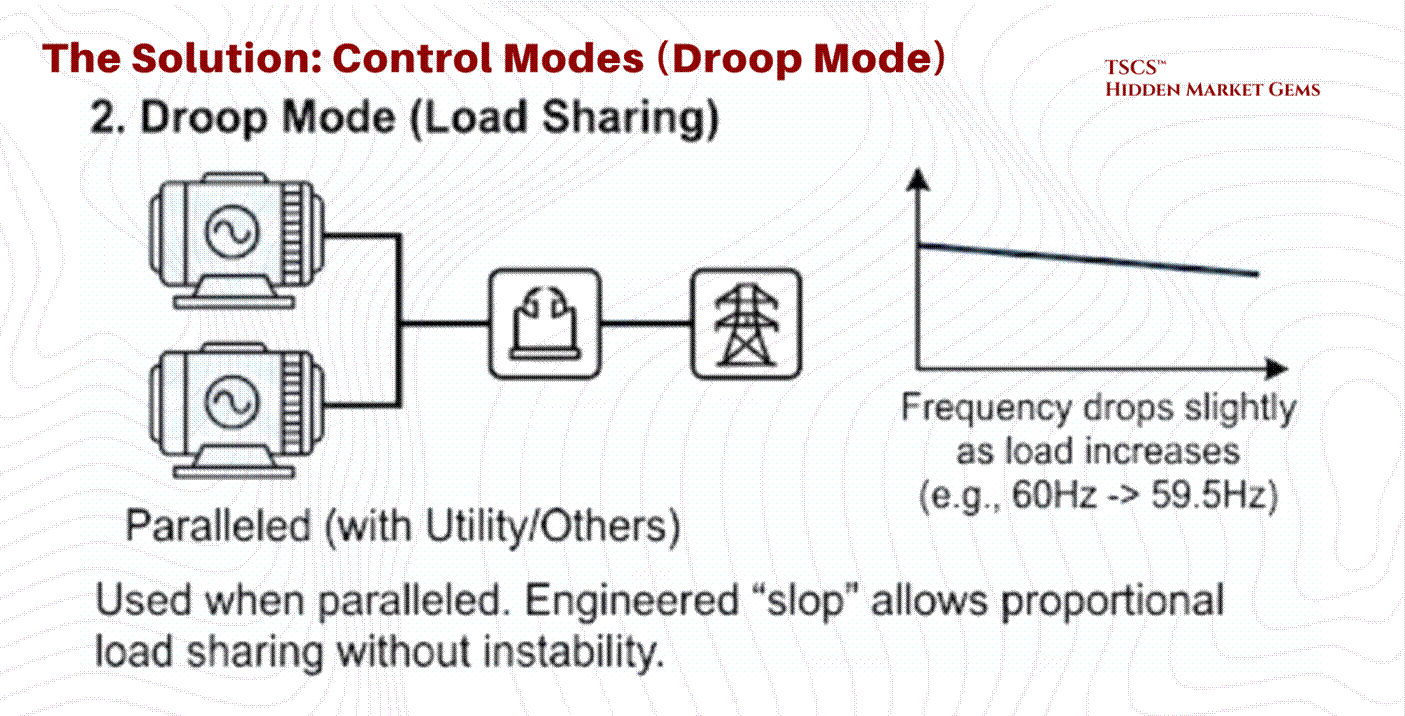
Droop Mode (Load Sharing): This is used when paralleled with the utility or other generators. The generator is programmed to slightly lower its frequency as load increases (typically a 3 to 5% droop from no-load to full-load, e.g., dropping from 60Hz to ~58.2Hz at maximum output). This engineered “slop” allows multiple generators to share the load proportionally without fighting each other for control. Without droop, two isochronous generators would fight, with one trying to hog the entire load, leading to instability.
2.3 Cooling Methodologies
The removal of heat is the single largest operational expense in a data center after the IT load itself. As chip densities rise, the physics of cooling are shifting from simple air conditioning to complex thermodynamic management.
2.3.1 Sensible vs. Latent Heat
Understanding cooling efficiency requires distinguishing between the two fundamental forms of heat transfer.
Sensible Heat: This is “dry” heat. It is the energy that, when added to a substance, raises its temperature (e.g., heating air from 70°F to 80°F). It involves no phase change.
Latent Heat: This is “wet” heat. It is the energy used to change the phase of a substance without changing its temperature (e.g., boiling water into steam). In air conditioning, latent cooling is the energy spent removing moisture (humidity) from the air through condensation.
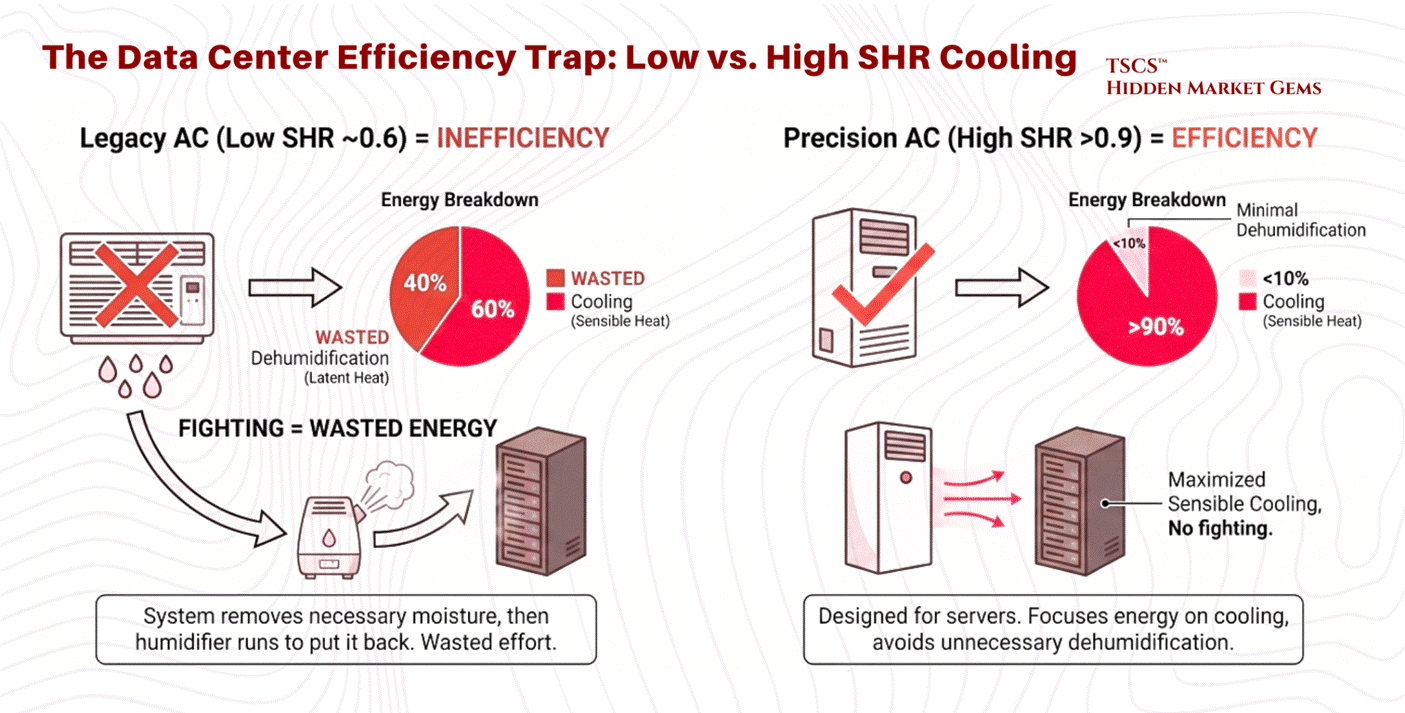
The Sensible Heat Ratio (SHR):
The Sensible Heat Ratio is the percentage of total cooling capacity used to lower temperature versus remove moisture.

The Data Center Requirement: Servers generate sensible heat almost exclusively. They do not sweat; they simply get hot. Therefore, data center cooling systems require a high SHR, ideally 0.85 to 1.0. Most precision cooling equipment is designed to operate at an SHR of 0.90 or above.
The Efficiency Trap: A system with a low SHR (e.g., 0.6) is wasting 40% of its energy removing moisture from the air, moisture that is often necessary to prevent static electricity. If the AC unit removes too much moisture (low SHR), the facility often has to run a humidifier to put that moisture back in. This “fighting” between dehumidification and humidification is a primary cause of inefficiency in legacy data centers. Modern Precision Air Conditioning units are designed to maximize sensible cooling, avoiding the inadvertent dehumidification common in comfort cooling systems.
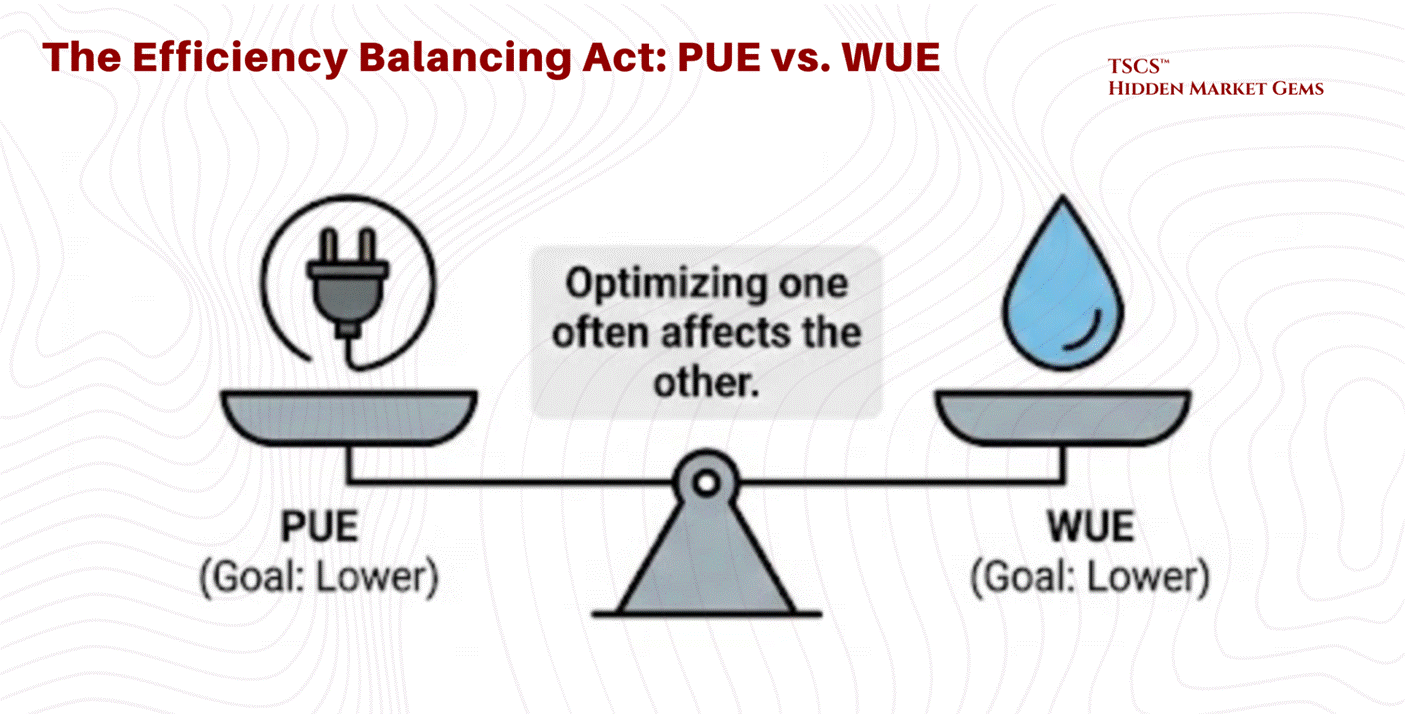
2.3.2 PUE vs. WUE
Efficiency in data centers is tracked via two primary, often opposing, metrics:
PUE (Power Usage Effectiveness): The ratio of Total Facility Energy to IT Equipment Energy. An ideal PUE is 1.0. This measures how much “overhead” electricity is used for cooling and power distribution.
WUE (Water Usage Effectiveness): The ratio of Water Usage (liters) to IT Equipment Energy (kWh). This measures the water footprint of the cooling process.
The Trade-off:
Optimizing one often degrades the other, creating a complex balancing act for operators.
Evaporative Cooling: Technologies like cooling towers use the evaporation of water to reject heat. This is extremely electrically efficient because water carries away massive heat during the phase change (latent heat of vaporization).
Result: Lower PUE (less electricity for compressors) but Higher WUE (massive water consumption).
Air-Cooled Chillers: These rely solely on fans and compressors (mechanical cooling) to reject heat into the air, using a closed loop of refrigerant.
Result: Lower WUE (near zero water use) but Higher PUE (high electricity consumption).
Adiabatic Cooling: A critical middle ground increasingly deployed by hyperscalers (Google, Meta, Microsoft). Hybrid adiabatic systems use water evaporation selectively, only on the hottest days, achieving 90 to 95% water savings versus traditional evaporative cooling while maintaining strong energy efficiency. This is the technology that is quietly rewriting the PUE/WUE frontier, and any operator ignoring it is leaving efficiency on the table
The Water Crisis:
In water-stressed regions, the aggressive pursuit of low PUE (using evaporative cooling) is increasingly scrutinized. A medium-sized data center can consume 110 million gallons of water annually, and large campuses up to 5 million gallons per day, equivalent to the consumption of a town of 50,000 people. This has led to the rise of “Water-Positive” initiatives and a renewed focus on WUE as a critical metric alongside PUE.
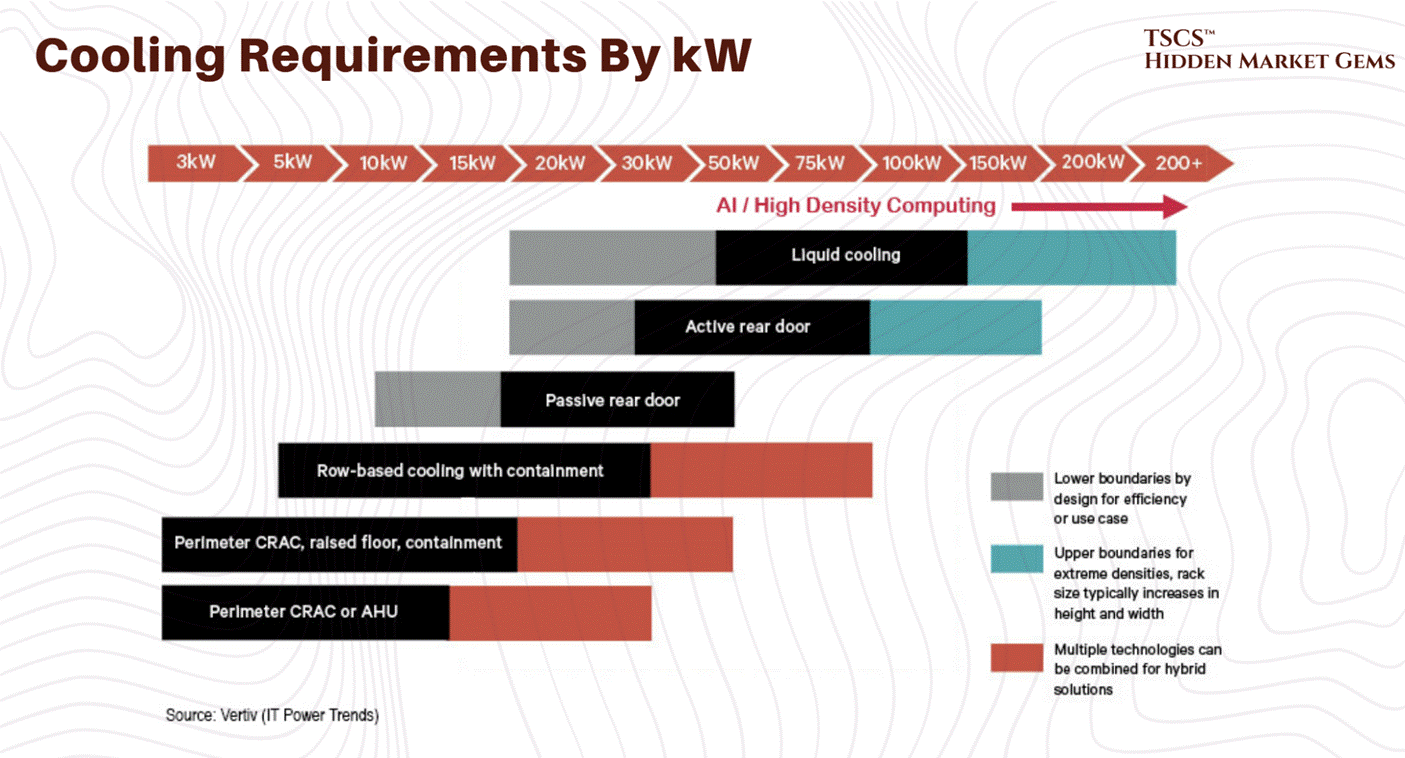
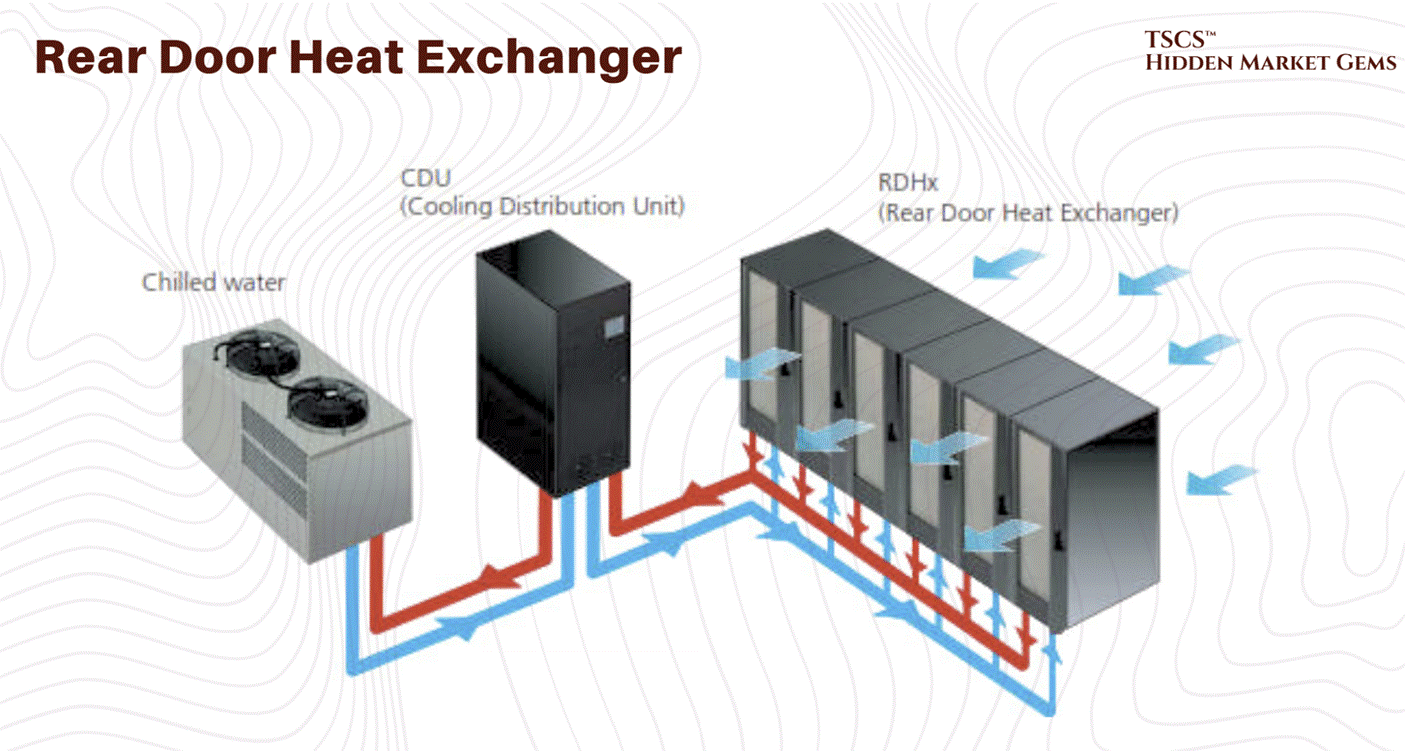
2.3.3 Airflow Management: Containment & Rear-Door Heat Exchangers
Before diving into liquid cooling, it is worth acknowledging the technologies that represent where most of the industry actually operates today: the practical middle ground between legacy air conditioning and full liquid immersion.
Hot-Aisle / Cold-Aisle Containment: The simplest and most widely deployed efficiency upgrade in modern data centers is physical containment, using curtains, panels, or rigid enclosures to prevent hot exhaust air from mixing with cold supply air. Without containment, a data center is essentially trying to cool a room where someone left all the windows open. This sounds basic, but the efficiency gains are significant, often reducing cooling energy by 20 to 40%.
Rear-Door Heat Exchangers (RDHx): RDHx units mount directly on the back of a server rack and use chilled water coils to capture exhaust heat before it enters the room. Think of it as strapping a radiator to the back of every cabinet. The results are compelling: RDHx can handle 30 to 75 kW per rack, which covers the vast majority of current deployment densities including many AI workloads. According to the Copper Development Association, 83% of new data centers plan to deploy RDHx technology. This is the bridge technology between air and full liquid, and for operators who are not ready to replumb their entire facility, it is often the right answer.
2.3.4 Liquid Cooling
As chip densities rise to support AI workloads, traditional air cooling is hitting a physical wall. Air is a poor conductor of heat compared to liquid. Consequently, liquid cooling, with its superior specific heat capacity, is becoming the inevitable successor for high-performance computing.
March 2026 Update: Liquid cooling is no longer emerging. It is table stakes for AI infrastructure. The data center liquid cooling market roughly doubled in 2025 to approximately $3 billion, with Dell'Oro Group projecting it will hit $7 billion by 2029. Goldman Sachs equity research (November 2024) forecast liquid-cooled AI servers rising from 15% of shipments in 2024 to north of 50% in 2025 and above 70% by 2026. A follow-up Goldman analyst note in July 2025 refined these figures to 15%/45%/74% for AI training servers specifically. Regardless of which estimate you anchor to, the trajectory is vertical. That is not a transition. That is a phase change. Vertiv's January 2026 Frontiers report identified five defining data center trends for 2026, with adaptive liquid cooling among them (alongside digital twin technology, AI-driven power management, and sustainability frameworks). CoolIT has been iterating aggressively on its Coolant Distribution Unit lineup, releasing the CHx1000, CHx1500, and CHx2000 in rapid succession, each claiming new density records. And the M&A market is confirming the thesis in real time. Eaton announced a $9.5 billion deal to acquire Boyd Corporation's thermal management business in November 2025 (expected to close Q2 2026). Trane Technologies agreed to acquire Stellar Energy Digital in December 2025, closing the deal in early 2026. These are not speculative bets on future adoption. Capital is chasing installed demand, right now.
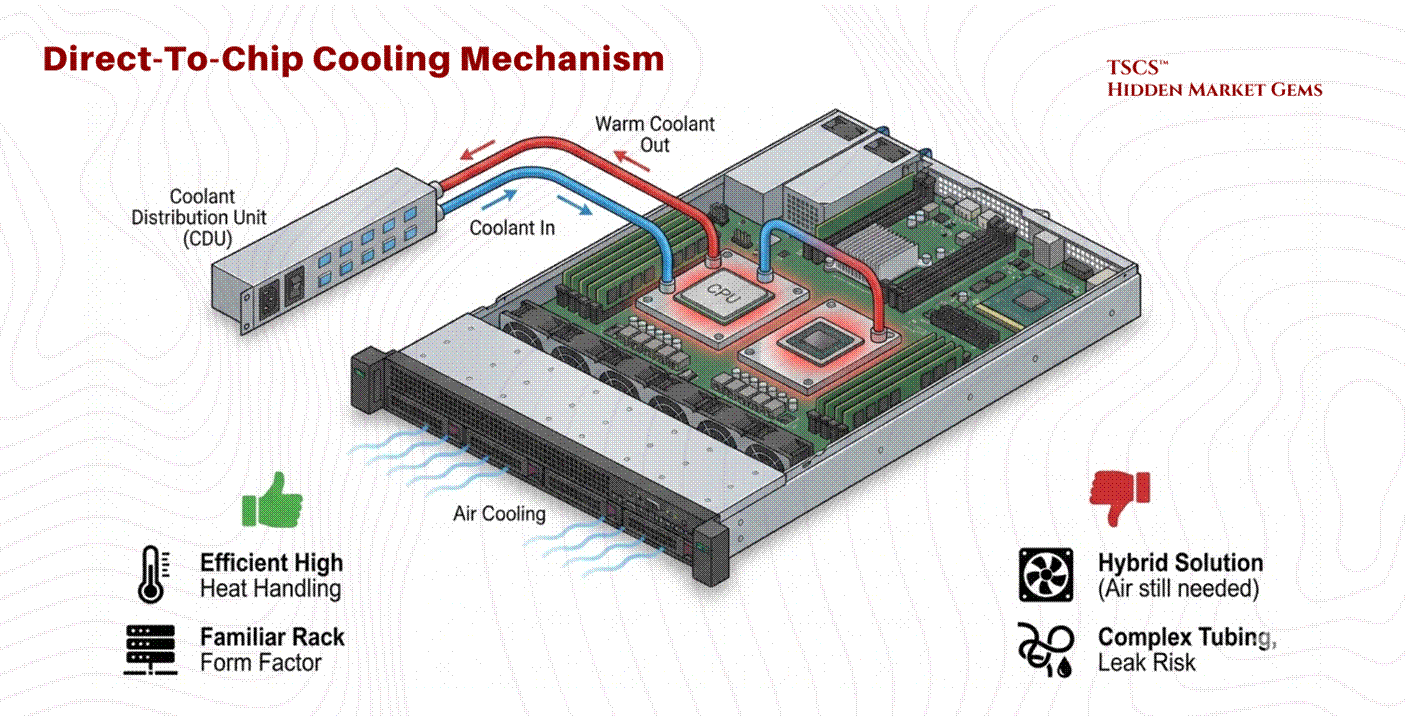
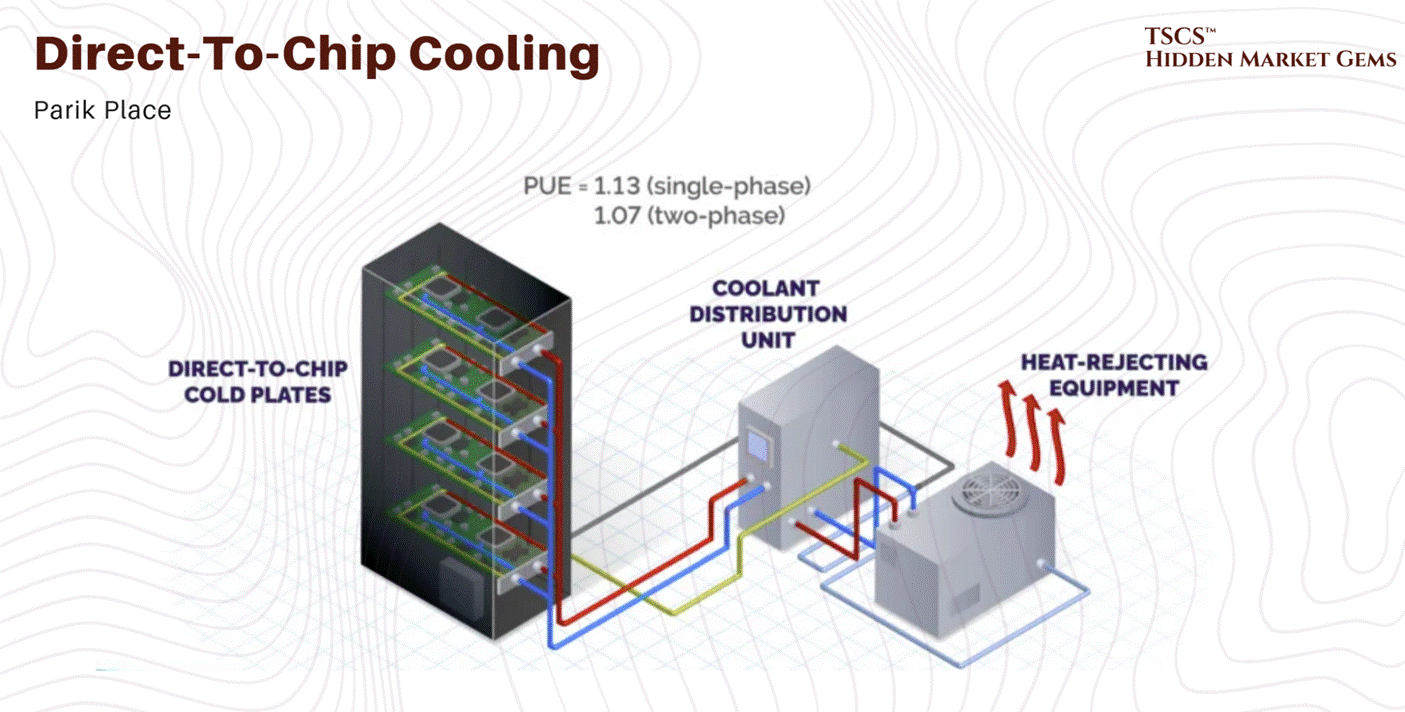
Direct-to-Chip (DTC)
Direct-to-Chip cooling involves circulating coolant through a cold plate that is directly mounted on high-heat components (CPU, GPU).
Mechanism: A liquid loop brings cool fluid to the cold plate, which absorbs heat via conduction and carries it away to a Coolant Distribution Unit (CDU).
Pros: Efficiently handles high heat flux (heat per unit area) at the source. It retains a familiar rack form factor and is easier to service than immersion tanks.
Cons: It is typically a hybrid solution. Because the cold plate only touches the processor, the rest of the motherboard (DIMMs, VRMs) still requires air cooling fans. It introduces a complex network of tubing, manifolds, and quick-disconnect couplings into the rack, increasing the risk of leaks. The emerging industry standard for next-generation racks is approximately 70% liquid (via DTC for processors) and 30% air (for remaining components).
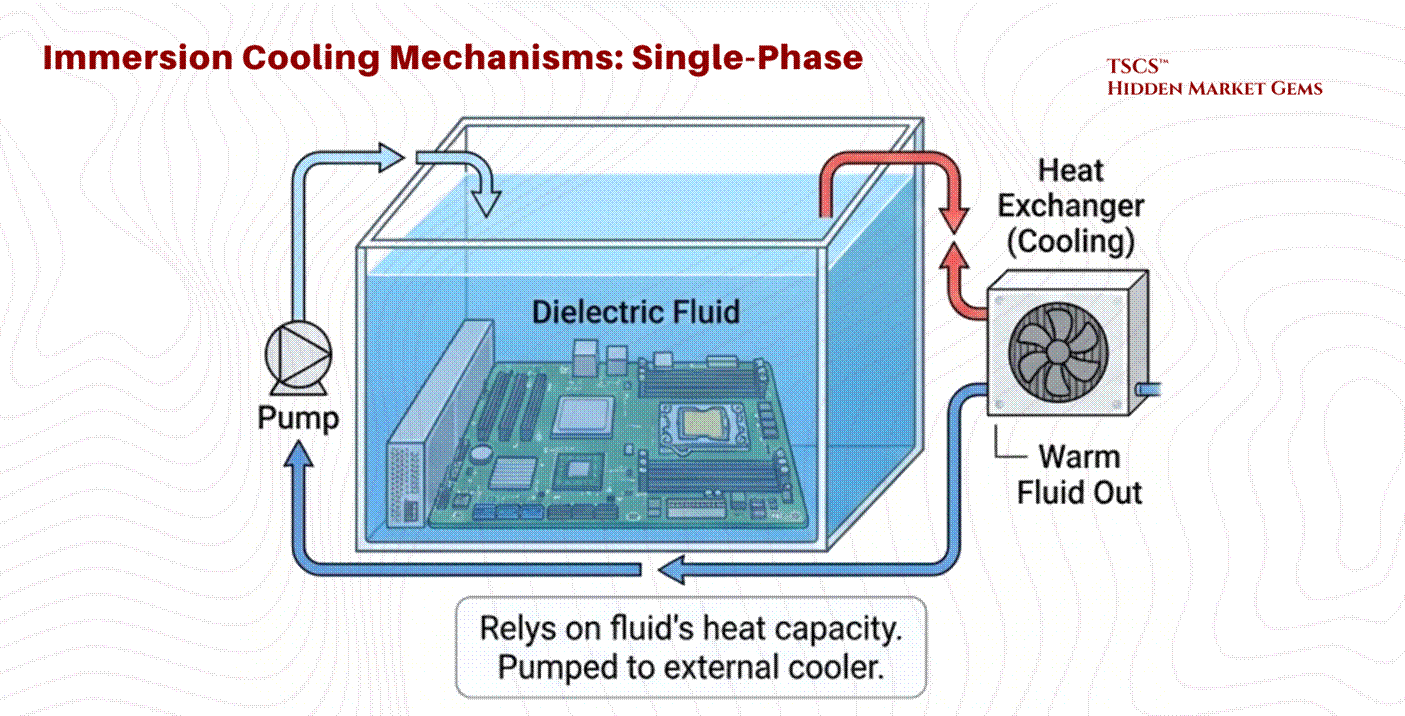
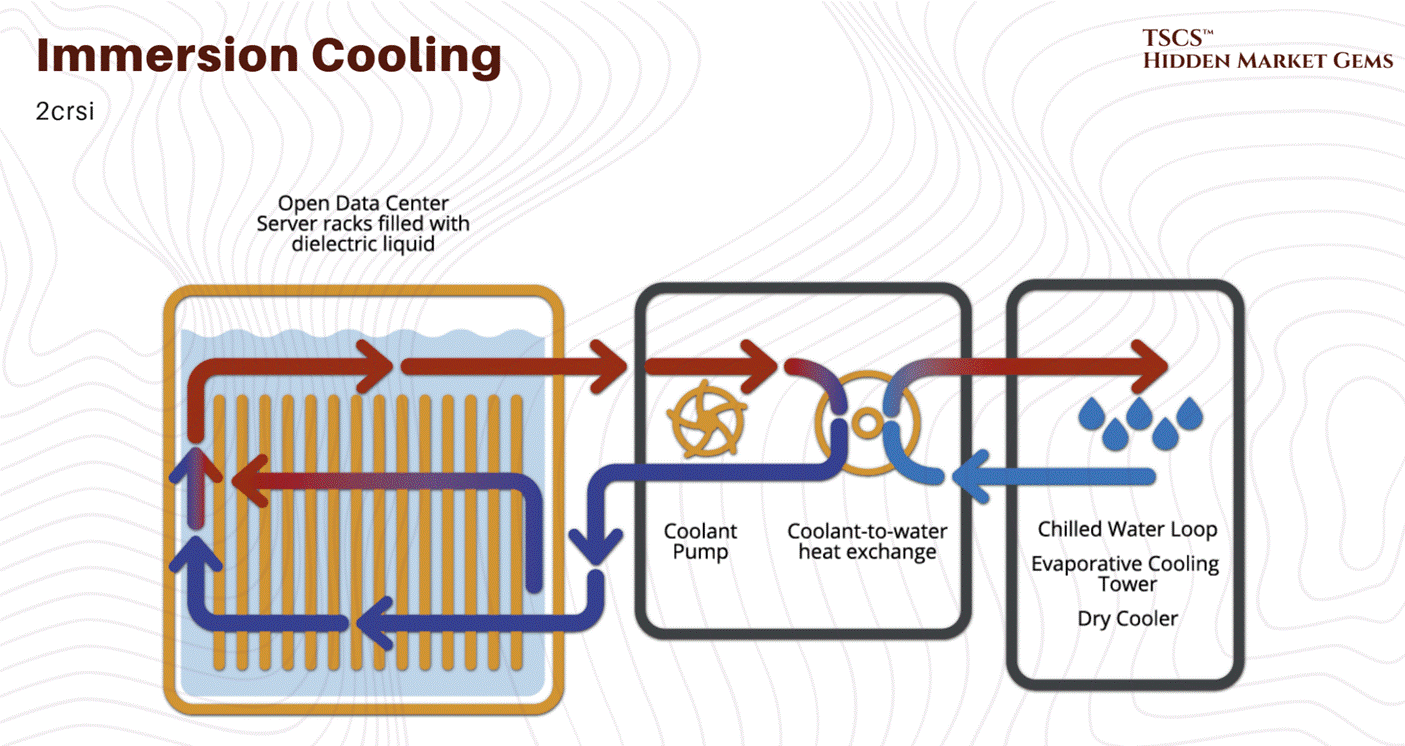
Immersion Cooling
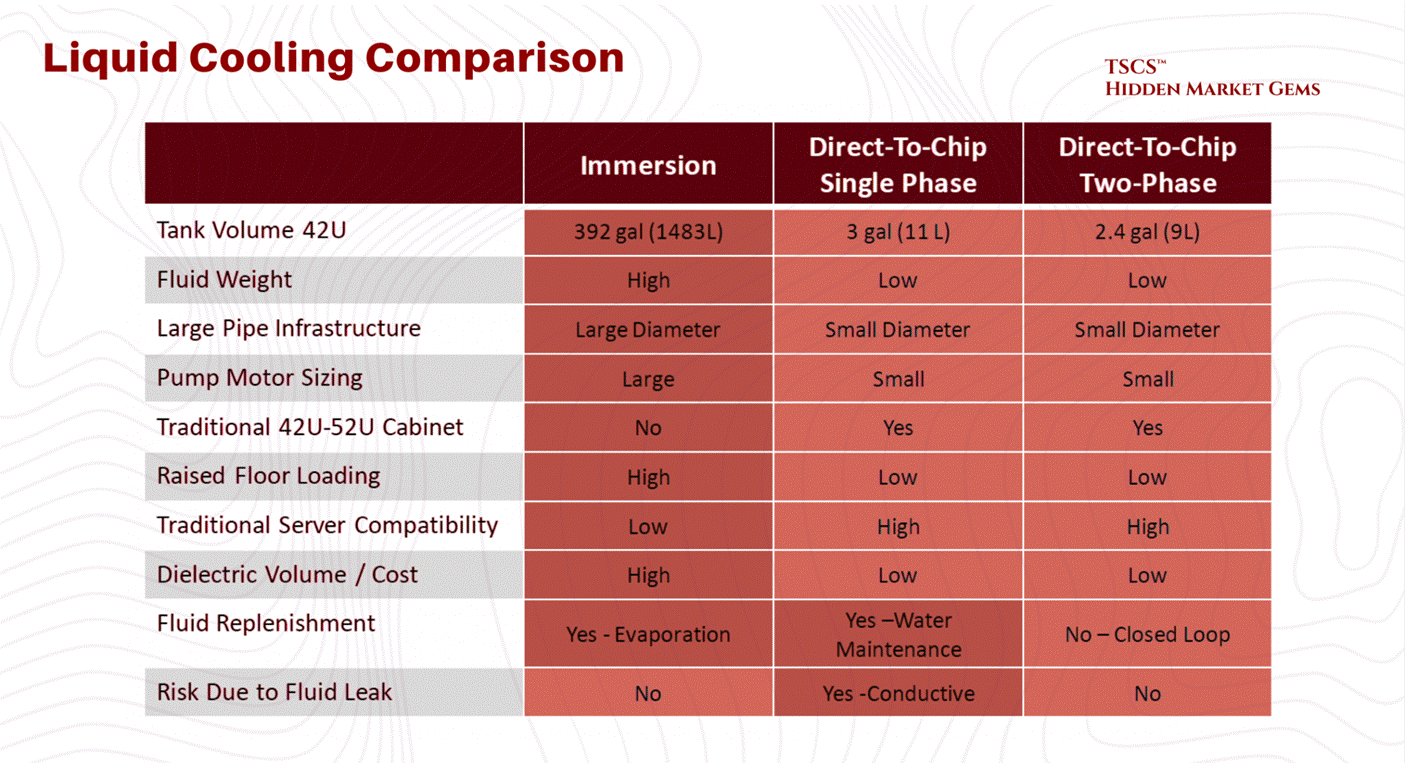
Immersion involves submerging the entire server (motherboard and all) in a dielectric (non-conductive) fluid.
Single-Phase: The fluid stays liquid. It is pumped through the tank and then to a heat exchanger to be cooled. It relies on the heat capacity of the fluid.
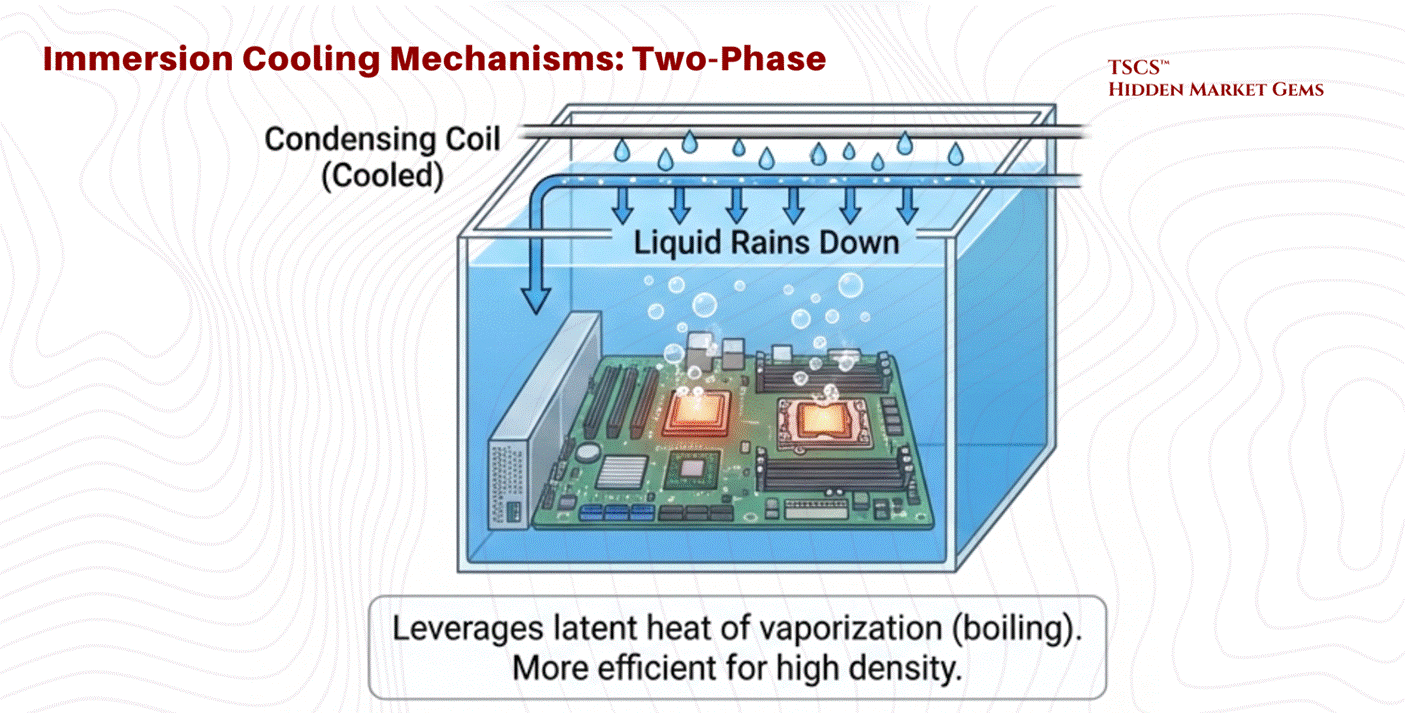
Two-Phase: The fluid boils on contact with hot chips. The rising vapor condenses on a cooled coil at the top of the tank and rains back down as liquid.
Physics of Two-Phase: This method leverages the latent heat of vaporization, which absorbs massive amounts of energy without a temperature rise. Two-phase systems can achieve heat transfer coefficients up to ~500 W/cm², versus roughly 16 W/cm² for single-phase water cooling, making it significantly more efficient than single-phase methods. Dr. Ali Heydari of NVIDIA predicts that while single-phase has 5-7 years of viability, the industry will inevitably shift to two-phase for future high-density needs. Intel's Dr. Dev Kulkarni has voiced similar timelines.
Advantages: Captures 100% of the heat (no fans needed), enabling silence and higher efficiency. Thermal inertia allows the system to ride through cooling failures longer without overheating.
Retrofitting Challenges
Migrating from air to liquid is not a simple upgrade.
Plumbing Infrastructure: Legacy data centers were designed to keep water out of the server room. Retrofitting requires running fluid loops to every rack, a plumbing nightmare that operators are right to fear. The Uptime Institute's 2021 survey found the top barriers to liquid cooling adoption were: limited choices for liquid-cooled IT systems (47%), lack of standardization (45%), maintenance concerns (40%), cost (40%), and reliability concerns (32%). Note that the biggest barrier is not complexity of integration but the supply-side constraint of available hardware. This distinction matters: it suggests adoption accelerates as OEMs ship more liquid-ready platforms, which is exactly what is happening in 2025 and 2026.
Structural Weight: Liquid tanks are heavy. A facility with a standard 150 PSF floor cannot support immersion tanks without significant structural reinforcement.
Water Availability: As noted in Section 2.3.2, securing the necessary water rights and infrastructure is becoming a critical bottleneck. Unlike power and fiber, water usage is not fixed and depends heavily on the cooling topology chosen.
2.4 Connectivity & AI Paradigm
The modern data center is no longer just about storing data; it is about moving it at unprecedented speeds to support “AI Factories.”
2.4.1 The AI Factory Model
The concept of the “AI Factory,” championed by NVIDIA CEO Jensen Huang, represents a paradigm shift. Unlike traditional cloud data centers that host disparate applications for millions of users, an AI Factory is a dedicated facility designed to “manufacture intelligence”.
Agentic AI: The rise of agentic workflows (AI agents acting autonomously) demands orders of magnitude more computing performance and data throughput.
The Data Engine: As David Flynn of Hammerspace notes, the real engine behind AI is no longer just compute, but data. The ability to feed GPUs with data fast enough to prevent “starvation” is the primary bottleneck. This requires a global, unified view of data across cloud, edge, and physical environments.
2.4.2 Interconnects & Cabling
This shift impacts physical infrastructure.
Cabling Density: The bandwidth requirements of AI clusters (using technologies like NVLink) result in massive cabling density. In a raised floor environment, this cabling is often routed through the plenum. If not managed meticulously, these cables form “air dams,” blocking the flow of cooling air and degrading the efficiency of the entire facility.
Fiber Saturation: Fiber connectivity is now a “cornerstone” of site selection, equal in importance to power. The ability to move petabytes of training data requires proximity to major fiber backbones.
2.5 Security & Safety
A data center is a fortress. Its value lies not just in the hardware, but in the trust that the data within is inviolable. This requires a layered defense strategy, protecting against physical intrusion, fire, and environmental hazards.
2.5.1 Perimeter Defense
Physical security begins at the property line. The primary defense against vehicular attacks, whether accidental or malicious, is the bollard system. These barriers are rated according to their stopping power.
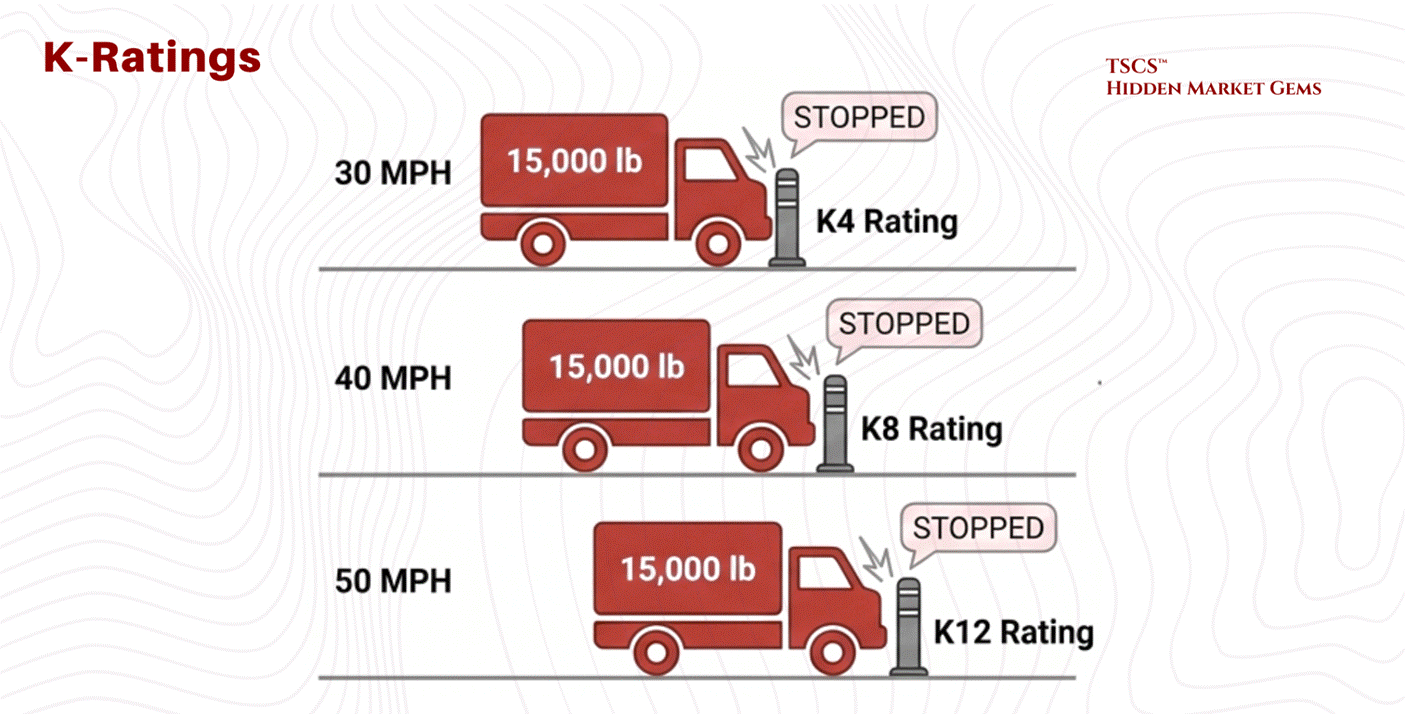
K-Ratings vs. M-Ratings:
Historically, the Department of State used “K-Ratings,” which measured the ability to stop a 15,000 lb vehicle.
K4: Stops a vehicle traveling at 30 mph.
K8: Stops a vehicle traveling at 40 mph.
K12: Stops a vehicle traveling at 50 mph.
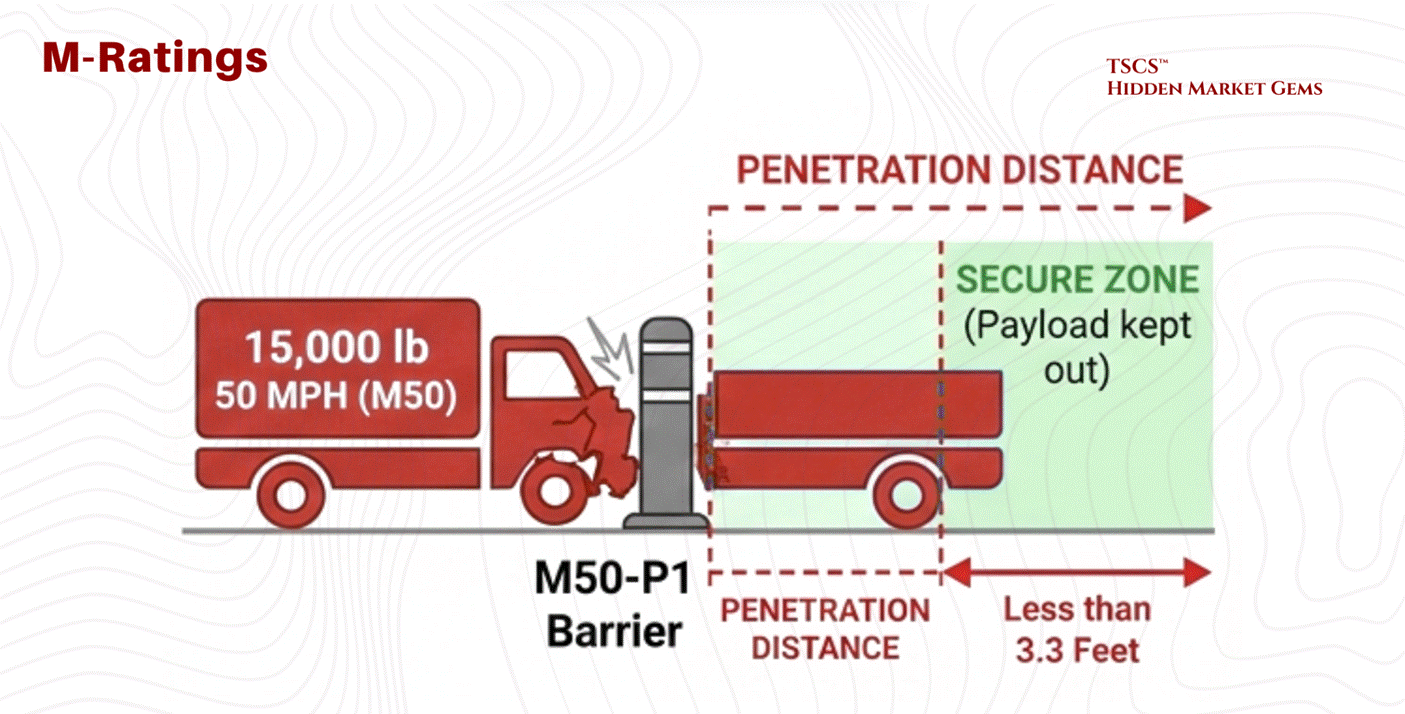
The industry has evolved to ASTM M-Ratings, which focus on penetration distance. It is not enough to stop the truck; the barrier must ensure the payload (explosives) does not penetrate the secure zone.
M50-P1: Equivalent to a K12 rating (stops 15,000 lbs at 50 mph) but certifies that the truck bed travels less than 3.3 feet past the barrier. This precise specification is critical for high-security sites like embassies or critical infrastructure.
2.5.2 Access Control
Once past the perimeter, the human element is managed through layered access control.
The Mantrap:
Entry to the white space (server floor) is typically guarded by a Mantrap, a security vestibule with two interlocking doors. The first door must close and lock before the second door opens. This prevents tailgating (an unauthorized person following an authorized one) and allows for a secondary authentication step in a secure, isolated zone.
Biometrics: Iris vs. Fingerprint:
For authentication, biometric scanning provides the highest level of certainty.
Fingerprint: While common, fingerprint scanners verify roughly 40-60 minutiae points. They are susceptible to failure due to dirt, cuts, or worn skin.
Iris Scanning: The “nuclear option” for security.
Accuracy: An iris scan analyzes 240 unique recognition points, providing significantly higher entropy and accuracy than a fingerprint.
Stability: The iris pattern is stable over a lifetime, whereas faces and fingerprints change with age and labor.
Hygiene & Usage: It is a non-contact technology, ideal for sterile environments. In high-security zones like the “Meet-Me-Room” (MMR) or Hardware Security Module (HSM) rooms, dual-control biometric locks (often iris) are standard.
Comparison: While facial recognition is excellent for surveillance (scanning crowds), it is prone to false positives. Iris recognition remains the superior choice for 1-to-1 critical authentication.
2.5.3 Fire Suppression
Fire is the existential threat to a data center. Detection and suppression systems must act fast enough to save the facility but gentle enough to save the data.
Detection: VESDA:
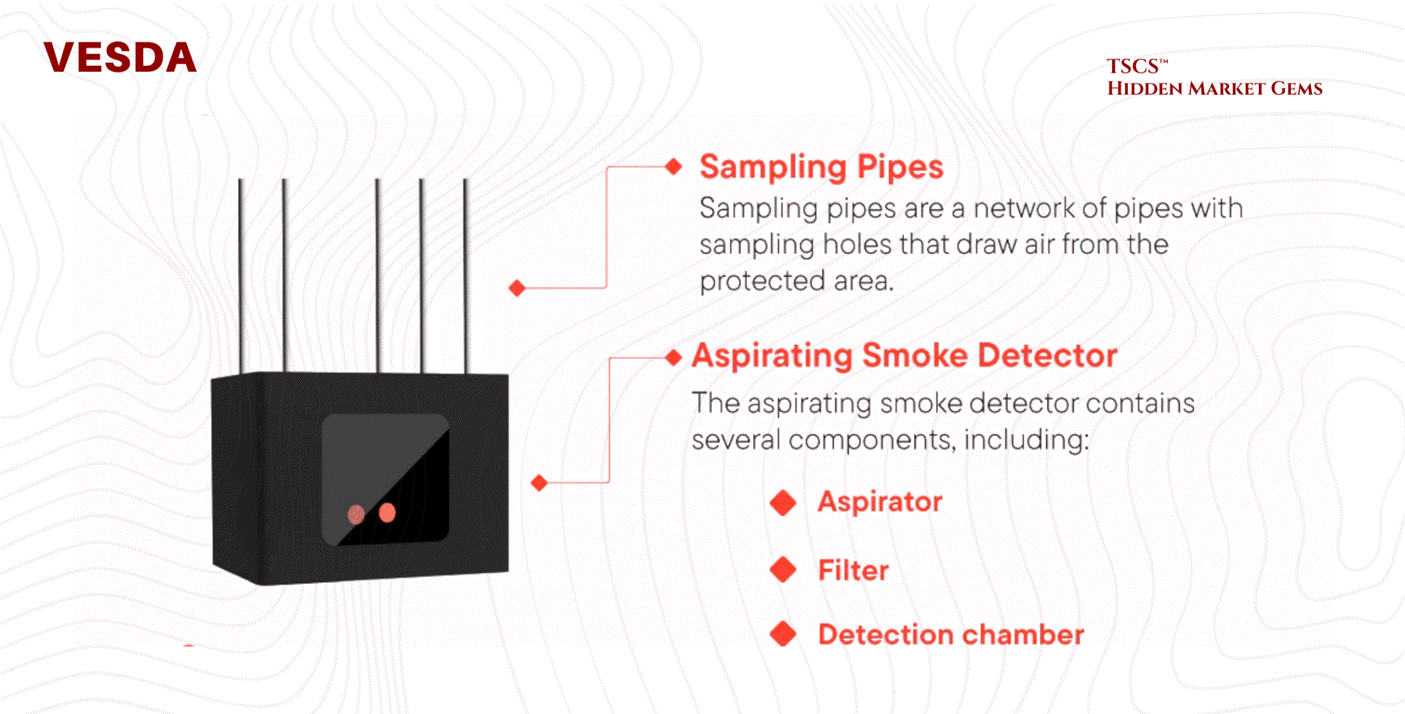
Standard smoke detectors are too slow for high-airflow data centers. The industry relies on VESDA (Very Early Smoke Detection Apparatus).
Mechanism: VESDA systems actively aspirate (suck) air through a network of sampling pipes into a central detector.
Nephelometry: Inside the chamber, a laser nephelometer measures light scattering from particles. It can detect smoke at obscuration levels as low as 0.005% per meter, long before smoke is visible to the human eye. This allows operators to detect overheating components (which off-gas before they burn) and intervene before a fire actually ignites.
Suppression - The Novec 1230 Phase-Out:
3M ceased all Novec 1230 manufacturing on December 31, 2025, with the last orders accepted March 31, 2025. The phase-out is complete. But here is the nuance that most coverage misses: the chemical is not disappearing. 3M’s patent on Novec 1230 expired in July 2020. The underlying compound, FK-5-1-12, is now manufactured by at least 13 UL-recognized entities, including Fike (SF 1230), Kidde (Fluoro-K), and TMC Industries. FK-5-1-12 remains listed in the EPA SNAP Program and approved under NFPA 2001. What 3M killed was a brand name, not a molecule.
The real risk is regulatory, not supply. FK-5-1-12 is technically classified as PFAS, which creates litigation exposure even though it differs materially from the PFOA/PFOS compounds that triggered the regulatory crackdown. Fifteen states have now banned PFAS in firefighting foam (New Jersey effective January 8, 2026; New York effective January 1, 2026). Minnesota launched its PRISM reporting system in January 2026, requiring manufacturer reports by July 1, 2026, though the state’s exemption for electronic and internal components extends until 2032. At the federal level, the EPA began expediting chemical reviews for data center applications under Executive Order 14318. The trajectory is clear: inert gas systems (IG-541) and high-pressure water mist are gaining traction as fully PFAS-free alternatives, and any operator building a new facility should be planning for a post-fluorinated future.
Rich Miller’s post “Going Prefab to Speed AI Capacity” briefly covers the shift to modular, factory-built data center components to bypass the “Supply Chain Choke Point".
Module 3 - IT Architecture and Technology
Modern data centers operate as sophisticated technological systems integrating hardware and software components to deliver computing at scale. Let’s see how it tangibly works.
3.1 The Core IT Components
Servers and Compute Architecture
You know it, servers form the computational core of data centers. Rack-mount servers, the industry standard, stack vertically in equipment racks for maximum density and operational flexibility. On the other hand, Blade servers consolidate multiple computing units in a single chassis for higher density but less flexibility. You need good servers, or you lose the data race. Period.
But the fundamental division separates CPU-based servers, optimized for diverse transactional workloads, from GPU-accelerated computers designed for massively parallel operations. GPUs excel at matrix operations and neural network inference essential for AI infrastructure.
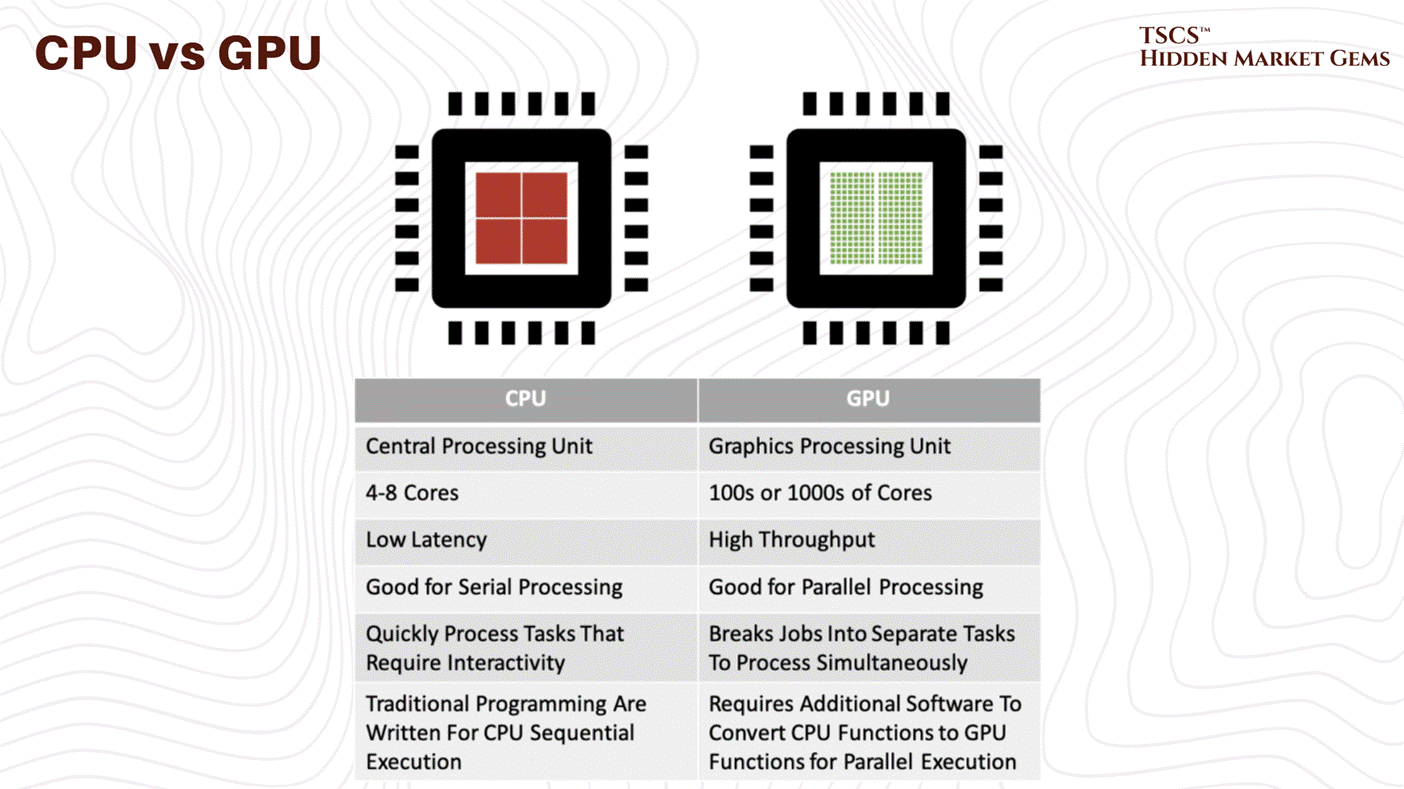
Indeed, modern facilities increasingly feature specialized accelerators beyond traditional GPUs, reflecting growing infrastructure specialization toward specific computational tasks. This represents a big, critical shift: the historical general-purpose data center is fragmenting into specialized environments optimized for particular workloads. So basically more efficient operations.
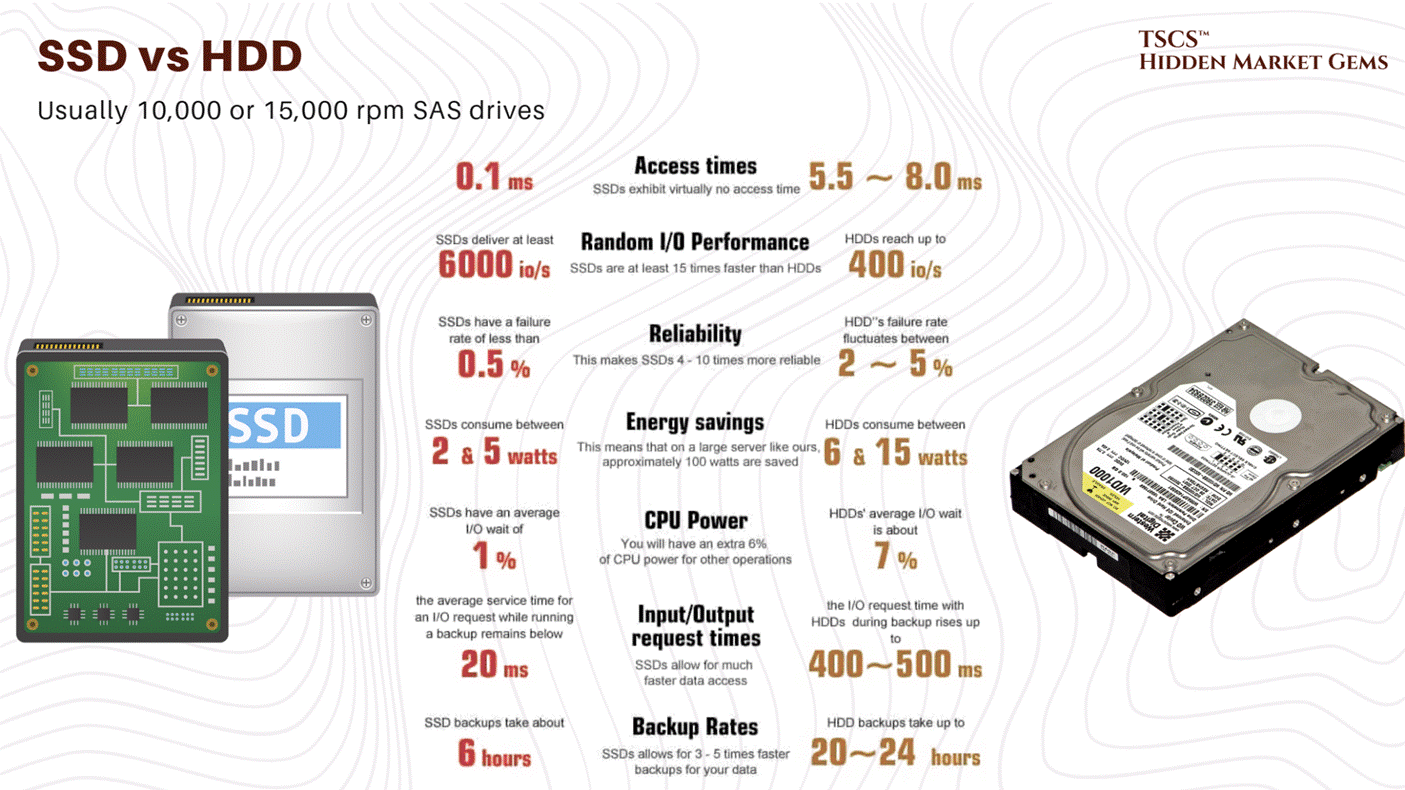
Storage Systems
Contemporary data centers employ three primary storage technologies: the first one, Solid State Drives (SSDs) and the second one, Non-Volatile Memory Express (NVMe) deliver microsecond-level access latencies essential for high-performance applications, in a nutshell, fast computers, giving results fast. On the other hand, Hard Disk Drives (HDDs) provide cost-effective bulk storage where latency tolerance is higher, you should look at it because in many ways it’s just better.
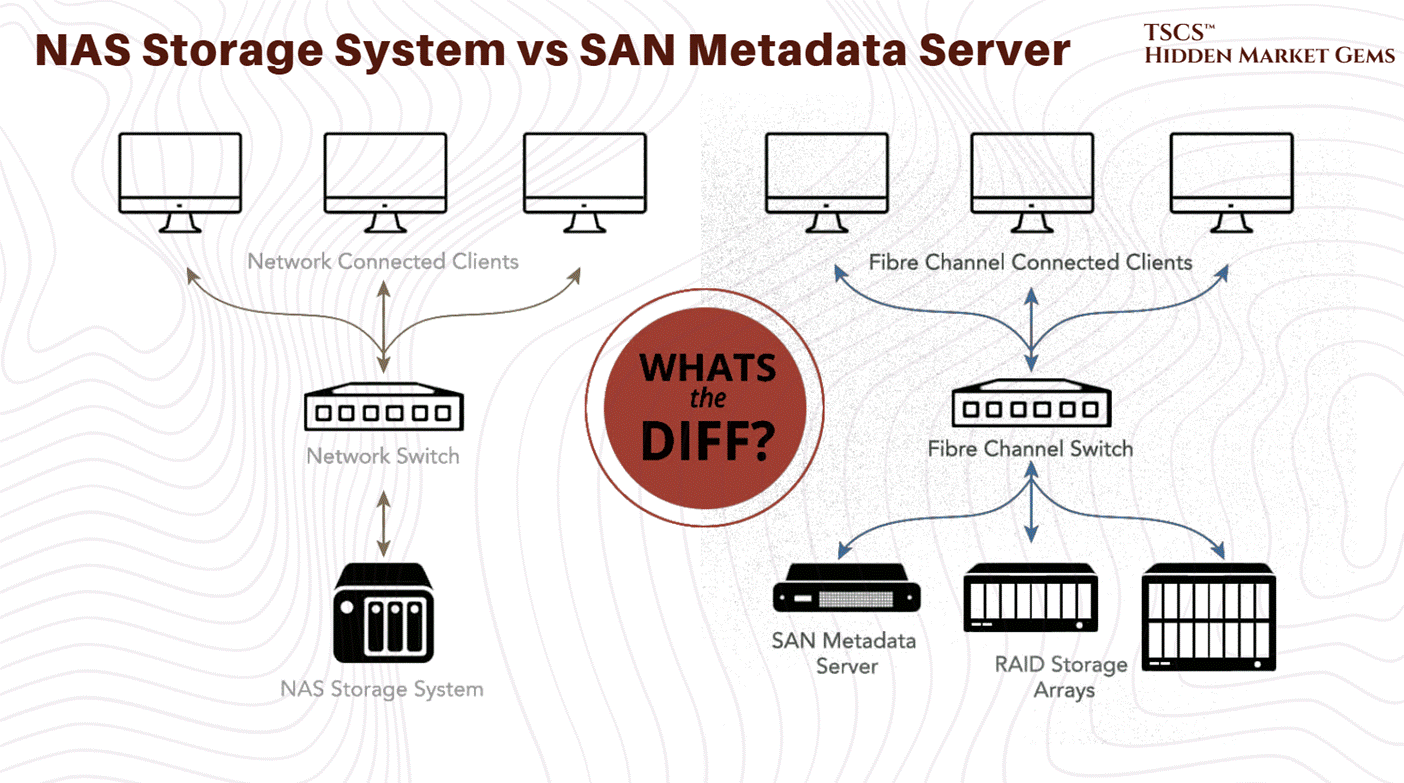
That way, storage Area Networks (SANs) deliver block-level storage through fiber optic connections with superior performance, while Network Attached Storage (NAS) uses standard Ethernet protocols for simpler management but lower performance.
Selection reflects workload requirements: AI training benefits from SSD/NVMe speed, while long-term archival exploits HDD cost efficiency.
Networking Hardware
Top-of-Rack (ToR) switches connect individual servers within equipment racks to higher-level infrastructure, aggregating traffic from 48-64 ports into uplinks. Modern deployments favor ToR architecture because it enables non-blocking designs and clearer operational separation between rack and higher-level infrastructure.
3.2 Virtualization and Cloud-Native Infrastructure
Virtual Machines and Resource Abstraction
That’s really straightforward;
Virtualization abstracts computing resources from underlying hardware, enabling multiple independent workloads to coexist on individual physical servers. Hypervisors allocate CPU, memory, and storage to isolated virtual machines, improving hardware utilization from historical 10-20% to 60-80%!
This directly improves asset utilization and cash generation on infrastructure investments while enabling rapid provisioning without additional hardware purchases.
Containers and Microservices
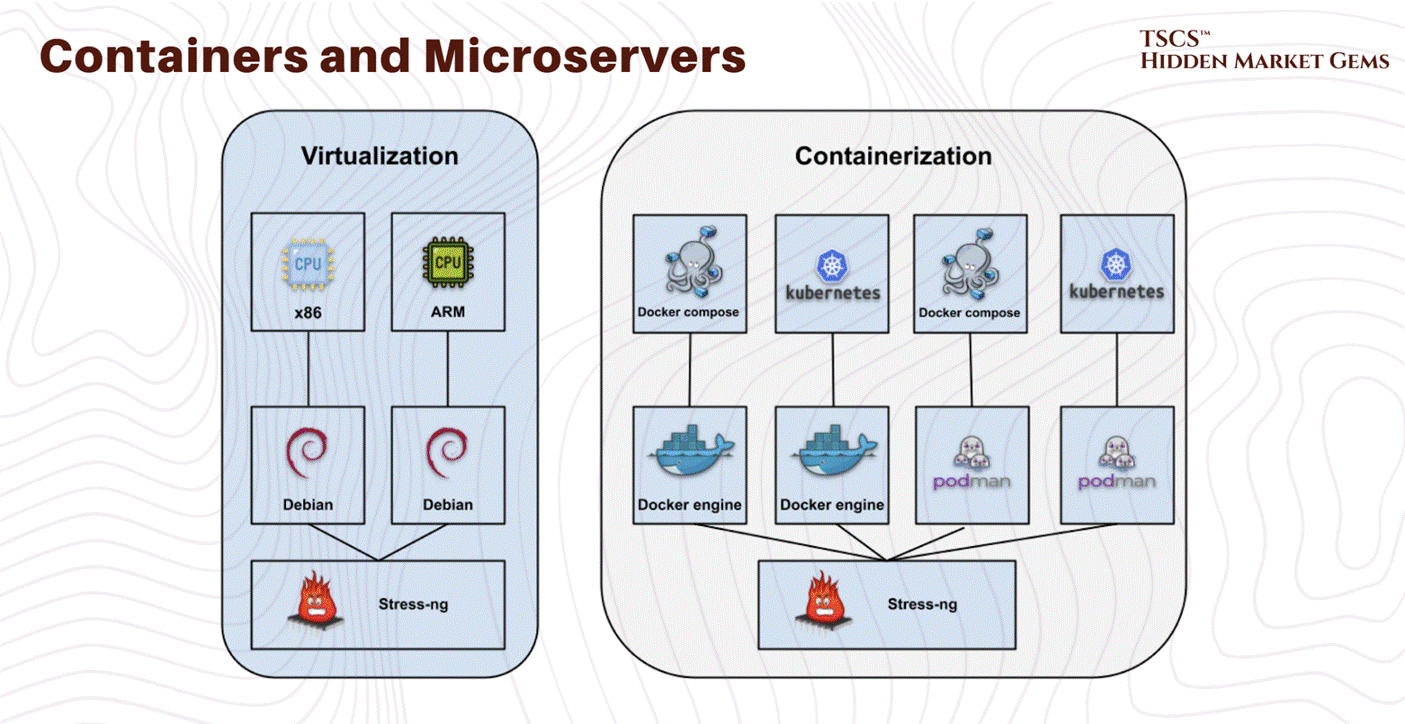
Container technology creates more lightweight virtualization than virtual machines by sharing the host operating system kernel. Docker established the container standard, with Kubernetes emerging as the dominant orchestration platform.
Containers enable microservices architectures where applications decompose into independent services running in separate containers, improving operational agility and resource efficiency. For infrastructure providers, containerization implies higher density packing and lower memory overhead than equivalent virtual machine deployments.
Modern data centers support both approaches (yes they can work together): virtual machines provide stronger isolation for legacy enterprise applications, while containers enable superior efficiency for cloud-native and AI workloads.
3.3 Internal Networking Architectures
Three-Tier vs. Spine-and-Leaf
Traditional three-tier network architecture organizes switches hierarchically, access switches connect to servers, aggregation switches consolidate access traffic, and core switches manage inter-rack communication.
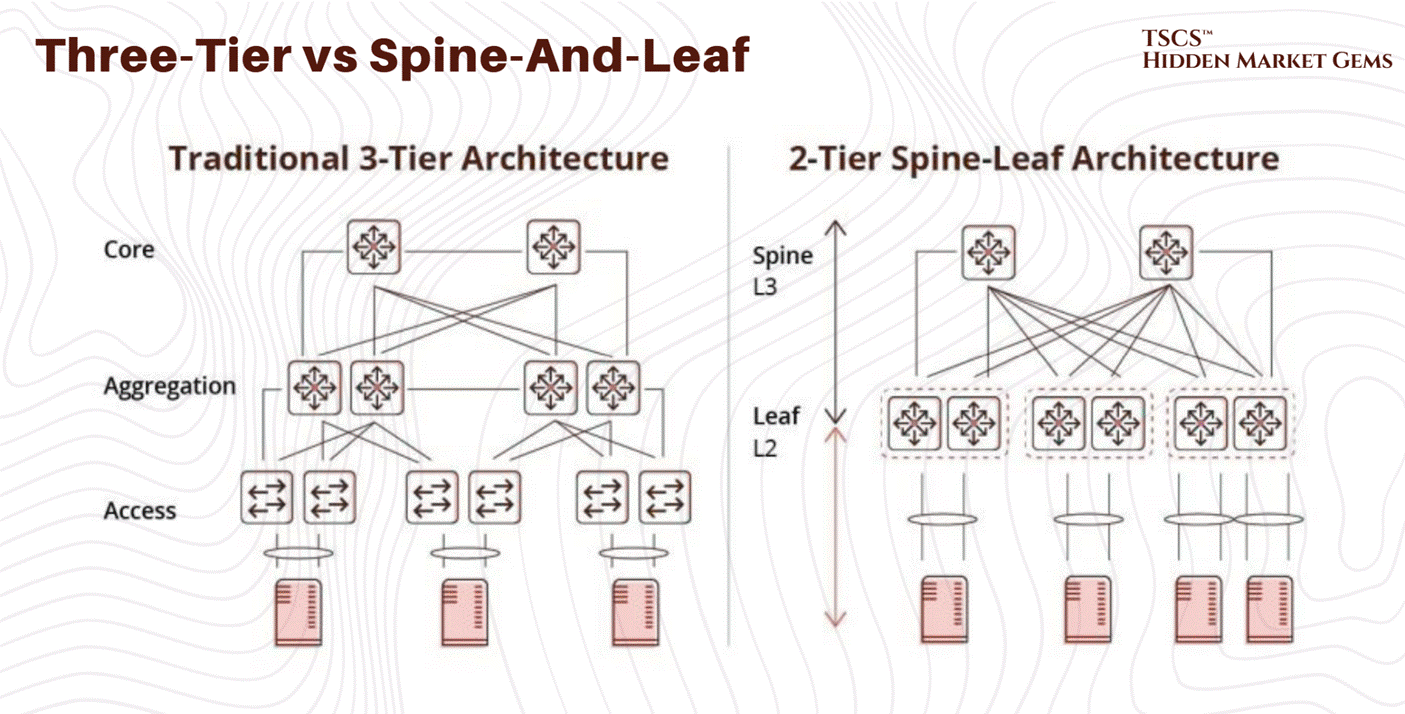
However with time this architecture exhibits fundamental limitations; core-layer capacity becomes the bottleneck as traffic volume increases… requiring expensive core switch upgrades for additional capacity…
So, Spine-and-leaf architecture employs a two-tier full-mesh topology where every access-layer switch connects to every high-capacity spine switch. So this non-blocking design ensures any server communicates with any other at full line-rate without contention. And capacity scales horizontally simply by adding spine switches, and path diversity enables traffic resilience to equipment failures. That’s good, and our answer to this problem.
For AI infrastructure, spine-and-leaf is operationally essential. GPU clusters training large models require sustained, predictable bandwidth between cluster members. Three-tier architectures create contention and unpredictable latency, degrading training performance. Spine-and-leaf elimination of bottlenecks enables GPU clusters to achieve theoretical maximum bandwidth.
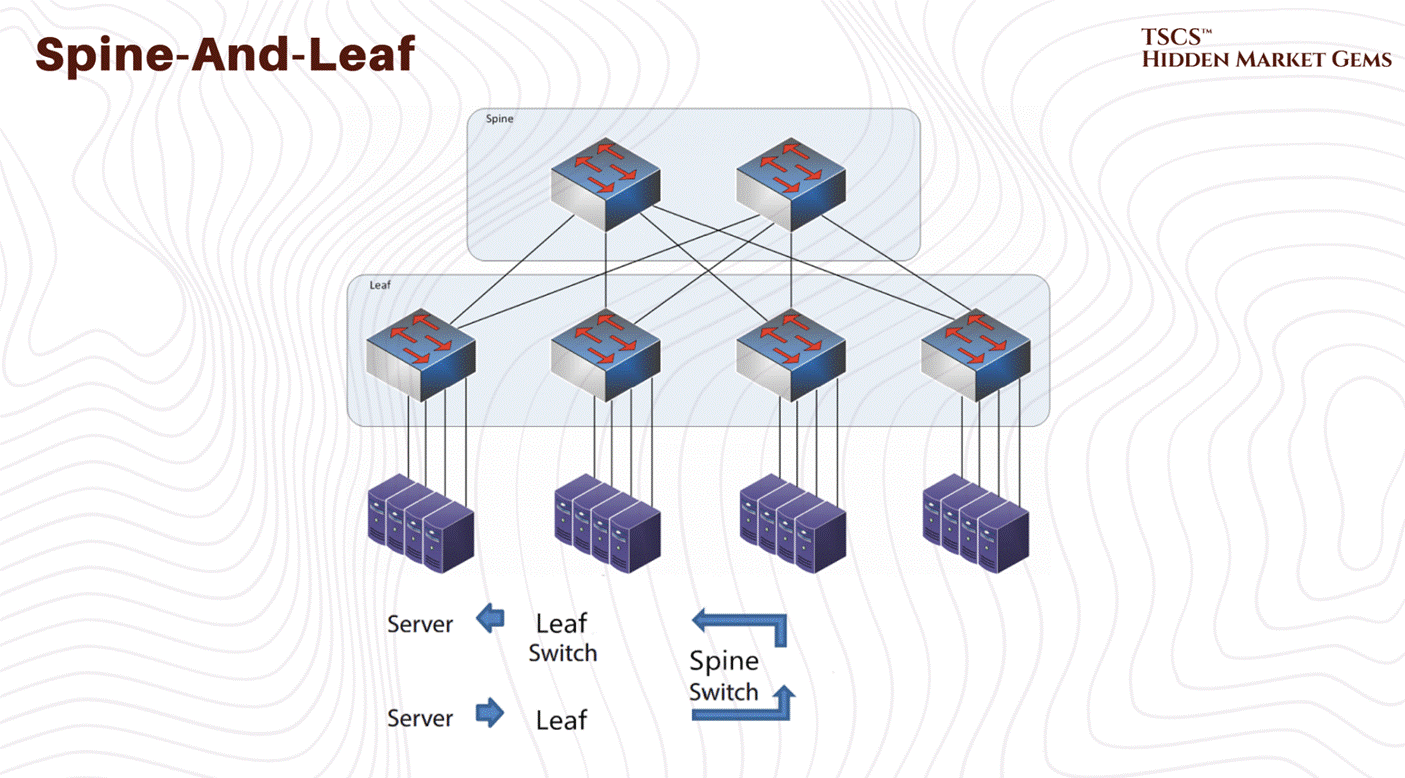
→ This architectural choice indicates long-term scalability positioning. Facilities with spine-and-leaf networking support emerging GPU-intensive workloads without constraints. Three-tier facilities face either continued bottleneck limitations or substantial redesign costs.
Keep that in mind.
Module 4 - Operations, Reliability, and Metrics
TSCS’ Strategist Note: While Module 2 was about the “Hardware” (the body), Module 4 is about the “Operating System” (the brain). This module defines the rules of the road, the mathematical probability of failure, and the scorecards used to measure efficiency.
4.1 The AI Thermal Shock
4.1.1 Density and Air
To understand why the industry is currently in a state of panic, and why liquid cooling stocks are rallying like it’s 1999, you have to look at the math of air cooling. It is not a linear problem; it is exponential. And nature, as it turns out, charges a steep tax for high performance.
Traditionally, we relied on mechanical chillers and forced air. Air is cheap, abundant, and dielectric (meaning it doesn’t short out your expensive motherboard if it touches a capacitor). It’s the safe choice. But air is also a thermal insulator. It has a low specific heat capacity (approximately 1.006 kJ/kg·K). It hates moving heat. As you pack more transistors into a silicon wafer, and more wafers into a chassis, the volume of air required to remove that heat grows, but not in a way that is polite or sustainable.
At 5kW per rack, the airflow required is negligible. At 20kW, it’s a stiff breeze. At 50kW, the “density cliff”, the physics turns against you with a vengeance.
The Cubic Law of Fan Power
Here is the equation that keeps facility managers awake at night, staring at the ceiling:
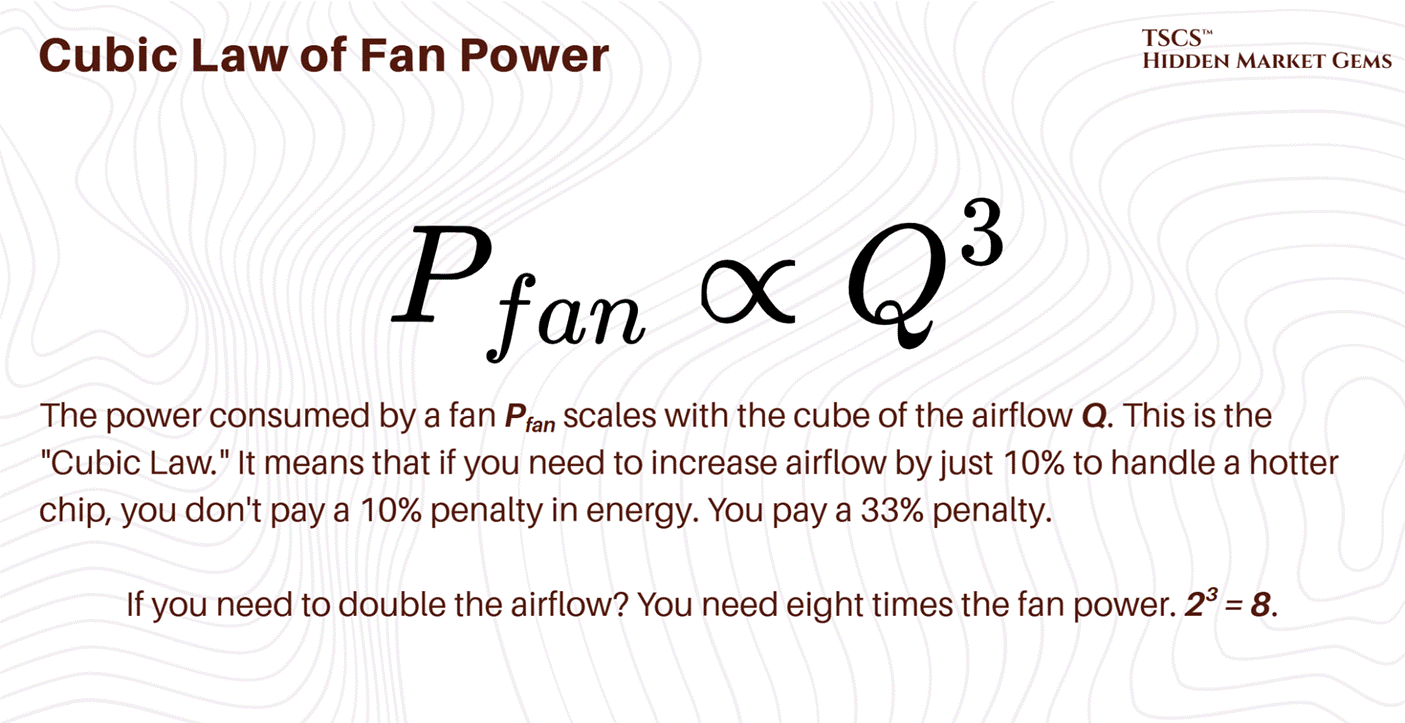
We are seeing this play out in real-time in data centers that are trying to stretch the limits of their legacy air-cooling systems. To cool a 50kW rack with air, you need roughly 7,850 cubic feet per minute (CFM) of airflow. That is not a gentle draft; that is a hurricane. The fans required to push that much air through the restrictive geometry of a server chassis (intakes measuring just 2-4 square inches) sound like jet engines and consume a massive percentage of the power delivered to the rack.
It becomes an “energy consumption spiral”. You are burning kilowatts just to move the air to cool the kilowatts. You reach a point of diminishing returns where the heat generated by the fan motor itself starts to contribute significantly to the thermal load you are trying to remove. This is the parasitic load of air cooling, and at 50kW, it becomes unsustainable.
At 100kW or 130kW, the domain of the Nvidia Blackwell, air cooling is not just inefficient; it is physically impossible. You would need over 15,000 CFM per rack. The velocity of the air required to achieve that would physically strip components off the motherboard. It would be an industrial wind tunnel, not a server rack.
4.1.2 The 75-Second Thermal Runaway
Let’s talk about what happens when the cooling stops. Because it will stop. A pump will seize, a valve will stick, a breaker will trip. In the old world, this was an inconvenience. In the AI world, it is a catastrophe.
In the old days of 5kW racks, if the CRAC (Computer Room Air Conditioner) units failed, you had time. The thermal mass of the room, the air volume, the concrete slab, the steel containment, the raised floor tiles, would absorb the heat. You might have 10, 15, maybe even 20 minutes to get the generators online or the chillers restarted before the servers hit their thermal shutdown limit (T-junction max). You could walk to the breaker panel. You could call your boss. You could grab a coffee.
With high-density AI clusters, that buffer is gone. Vaporized.
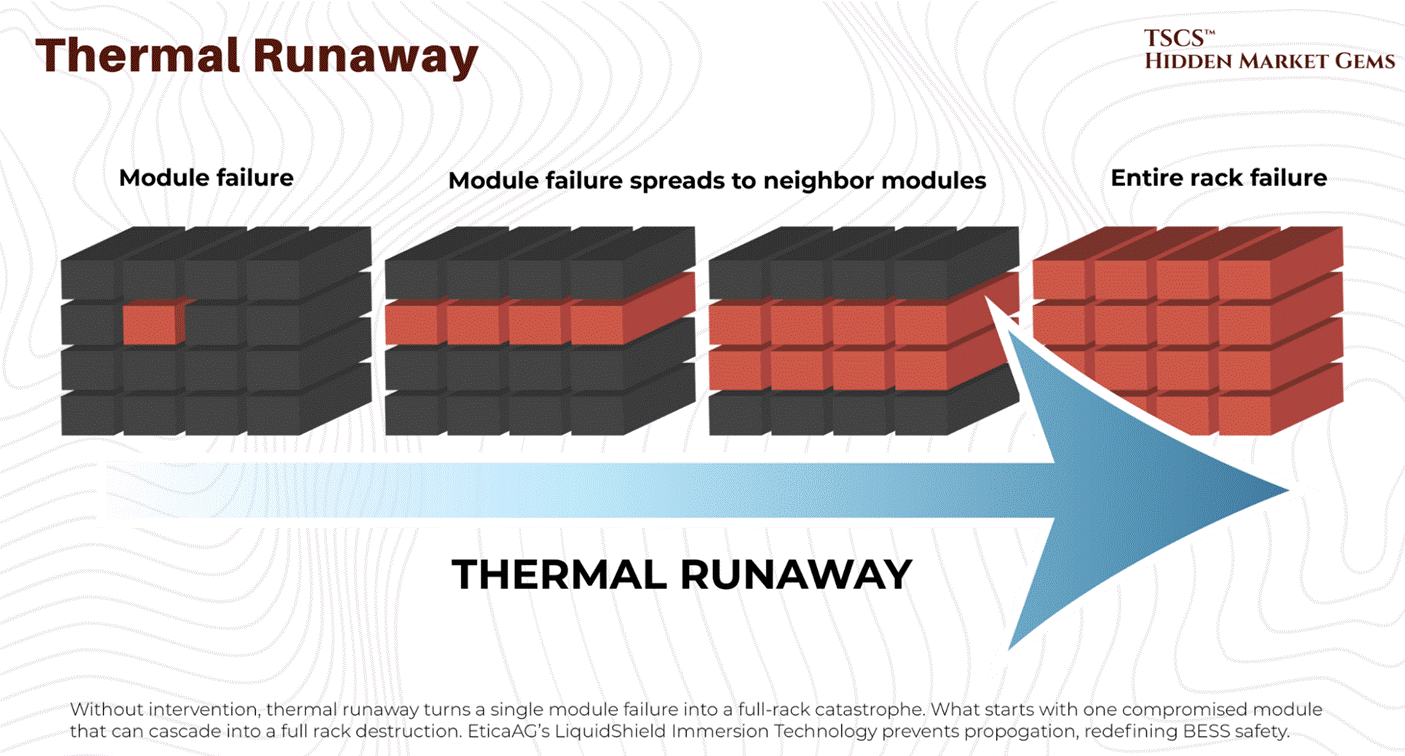
Reports indicate that at high densities (20kW+), thermal runaway is rapid. But with the new hyperscale densities, it is catastrophic. One documented case showed a 15 to 20 kW high-density pod going from a comfortable 72°F to over 90°F in just 75 seconds when cooling failed. At Blackwell-class densities (120 kW per rack), the timeline would be dramatically shorter.
Seventy-five seconds at legacy density. Potentially under ten at AI density.
Think about that timeframe. That is not enough time for a human to walk across the room, let alone diagnose a chiller fault. It is barely enough time for a diesel generator to crank, stabilize, sync with the bus, and accept the load. If your transfer switch hesitates, or if your Building Management System (BMS) needs to “poll” the sensor before reacting, your multi-million dollar H100 cluster is already cooking itself.
This creates a shitty operational reality: Thermal constraints are now tighter than power constraints. You can survive a brownout better than you can survive a cooling pump failure in a Blackwell rack. If the power cuts, the chips stop generating heat. If the cooling cuts but the power stays on, the chips turn into ceramic heaters instantly.
The operational doctrine has shifted from “detection and response” to “prediction and pre-emption.” You cannot wait for the temperature to rise. You have to monitor the rate of change (first derivative) of the temperature and kill the power the microsecond it deviates from the curve.
Which is why legends like Jim Chanos have warned against betting on data center landlords as an investment idea. We made an in-depth post as to why:

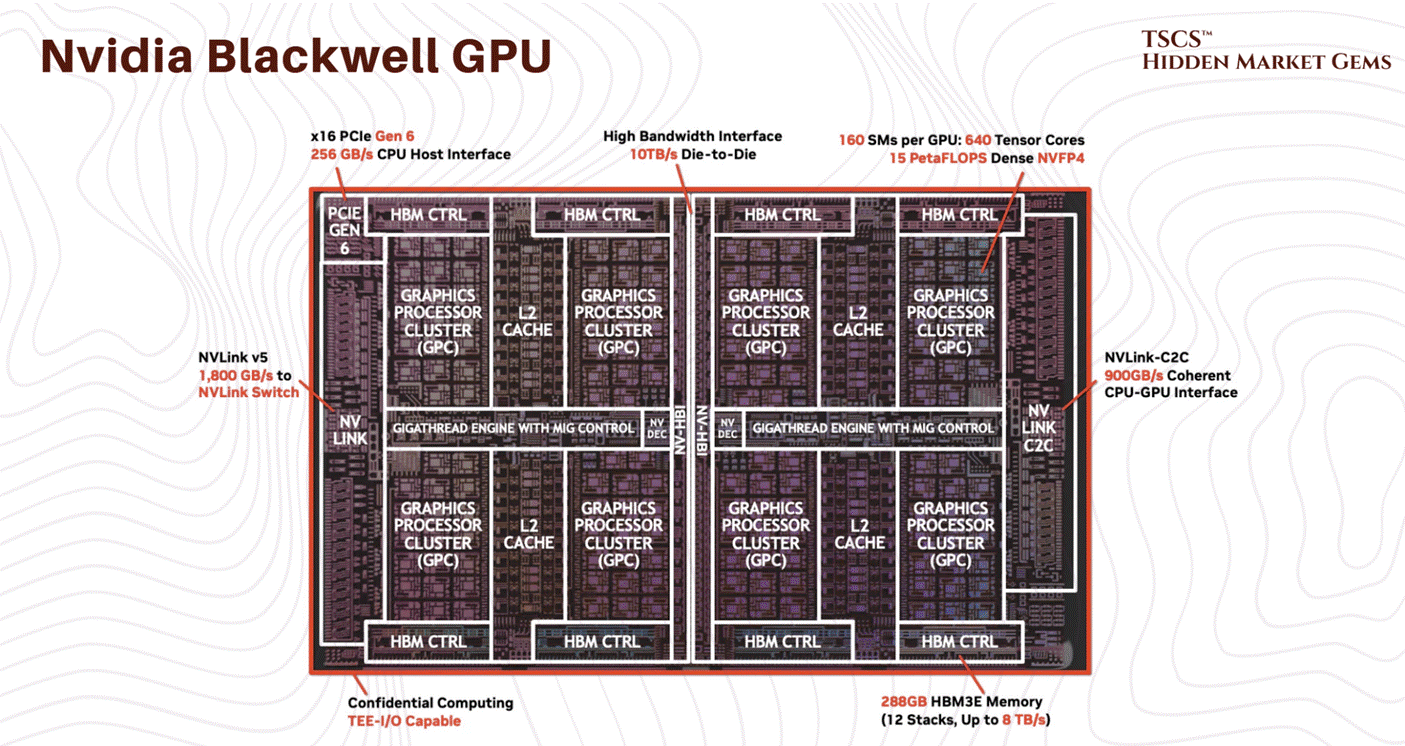
4.1.3 The Blackwell Effect
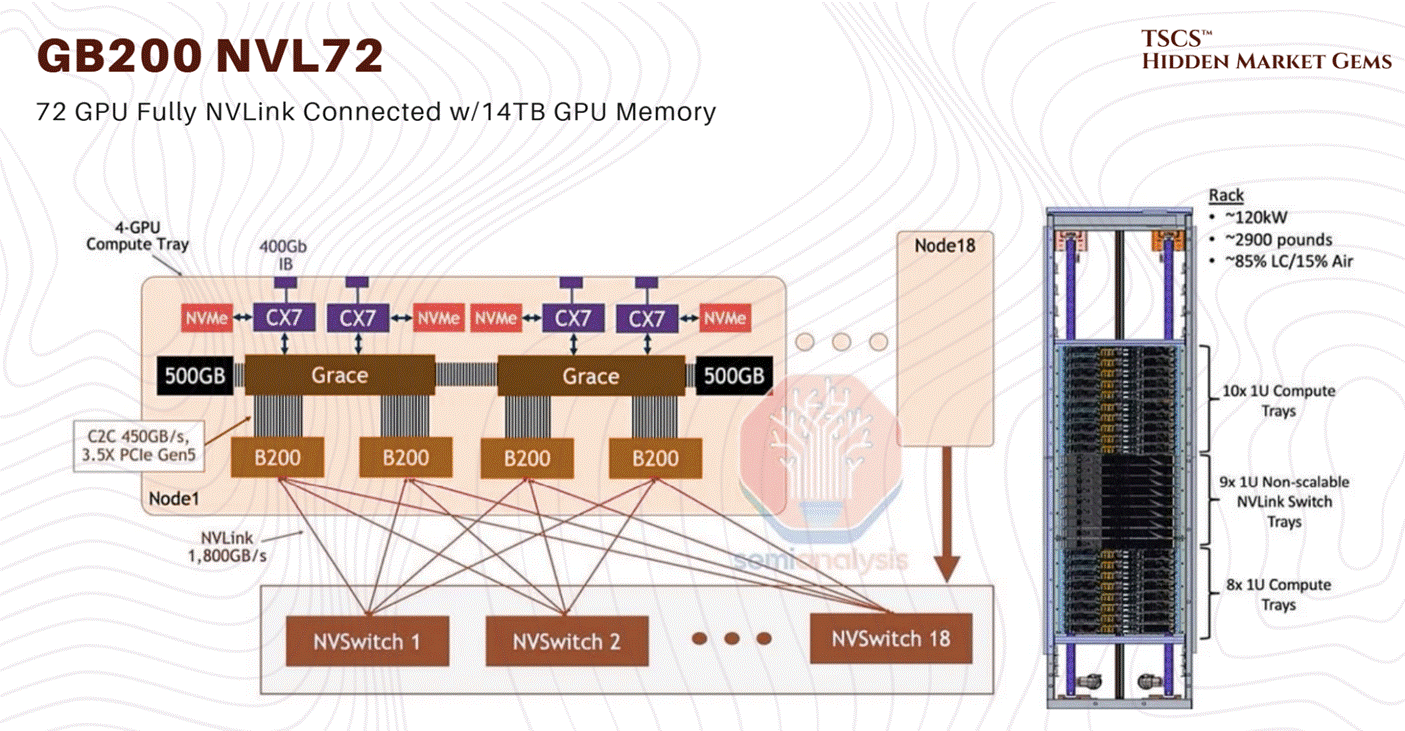
The Blackwell thermal issues that dominated the rumour mill in late 2024 are resolved. NVIDIA moved the GB200 NVL72 into full-scale volume production by early 2026. The CTE mismatch fix (modified top metal layers and bump structures) was implemented in late 2024 and validated through the production ramp. Crusoe Cloud published benchmarks on February 6, 2026 showing 3x faster Llama 3.1 fine-tuning on GB200 NVL72 versus prior-generation systems, confirming operational stability at scale. The ~120 kW per rack power density figure remains accurate and is confirmed across multiple deployments.
What has changed is the roadmap beyond Blackwell. The GB300 (Blackwell Ultra) entered production in Q3 2025 with 288GB HBM3e and 1,100 PFLOPS FP4 performance. Microsoft deployed the world’s first large-scale GB300 cluster. More significantly, NVIDIA announced Vera Rubin at CES 2026 in January, featuring the Rubin GPU architecture with 50 PFLOPS inference (5x Blackwell) and 288GB HBM4 memory, with volume production targeting H2 2026.
JP Morgan projects 5.2 million Blackwell GPUs shipped in 2025, dropping to 1.8 million in 2026 as Rubin ramps to 5.7 million units. NVIDIA’s Q3 FY2026 revenue hit $57 billion (+62% YoY), and the CFO stated visibility to “half a trillion dollars in Blackwell and Rubin revenue” through calendar 2026. The hardware constraint is real, but it is no longer a question of whether the platform works. It works. The question is whether the supply chain can build them fast enough.
4.2 The Liquid Revolution
4.2.1 Why Air is Dead
Liquid cooling is not a “nice to have” for the AI era; it is a prerequisite. It is the only way to navigate the density cliff without falling off. The physics are undeniable: Water is approximately 24 times more thermally conductive than air and has roughly 4,000 times the heat-carrying capacity by volume.
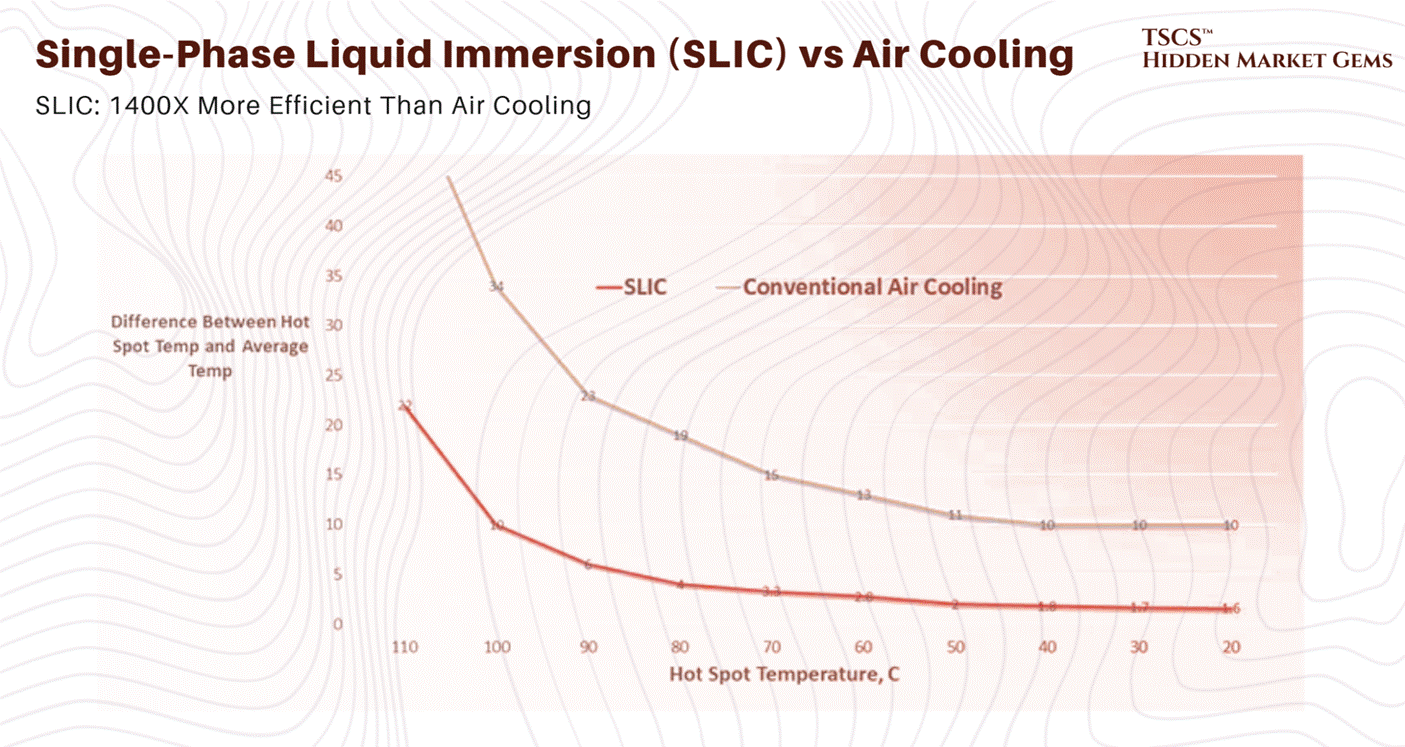
You can move more heat with a 1-inch pipe of water than you can with a 2-foot duct of air moving at gale force. This efficiency density is what allows us to pack 130kW into a rack.
The transition is happening in three main forms, each with its own operational headaches:
Direct-to-Chip (DTC) / Direct-to-Silicon: This is the Blackwell approach. Cold plates sit directly on the GPUs and CPUs. Water (or a dielectric fluid like propylene glycol) is pumped through micro-channels in the copper plate, absorbing heat right at the source. This captures about 70-80% of the heat. The rest still bleeds into the air from VRMs, DIMMs, and other components, meaning you still need fans, but they can run slower and quieter.
Rear Door Heat Exchangers (RDHx): This is the retrofit solution. You replace the back door of the server rack with a massive radiator. The servers blow hot air into the radiator, and the radiator absorbs the heat into a liquid loop before the air enters the room. It’s a band-aid, but a good one for legacy data centers that can’t rip up the floor. It effectively neutralizes the heat at the rack level.
Immersion Cooling: The “dunk tank.” You submerge the entire server board in a bath of non-conductive dielectric fluid (like engineered oil). This is the holy grail of thermal efficiency because it captures 100% of the heat. There are no fans. The liquid touches every component. But operationally? It’s a mess. Try swapping a failed DIMM stick when you have to pull the server out of a vat of oil, let it drip dry, and clean it with solvent. It’s slippery, it’s messy, and technicians absolutely hate it. It turns server maintenance into a wet, oily chore.
For Blackwell, Nvidia is pushing the GB200 NVL72 as a liquid-cooled native architecture. They utilize a Coolant Distribution Unit (CDU) to cycle fluid through the “compute trays.”
4.2.2 The Plumbing Nightmare
Moving to liquid changes the profile of the data center operator. You used to hire electricians and network engineers. Now, you need plumbers. And not just any plumbers, you need plumbers who understand clean room protocols and high-pressure fluid dynamics.
In an air-cooled data center, if a fan fails, you replace it. It’s a swappable part. If a fan makes a noise, you ignore it until it dies.
In a liquid-cooled data center, if a fitting leaks, you have a catastrophe. Water and electricity do not mix. If you are using water (with additives), a leak can short out a $200,000 compute tray in milliseconds. Even if you are using expensive dielectric fluids that don’t conduct electricity, a leak implies pressure loss. Pressure loss means flow loss. Flow loss means thermal runaway. See section 4.1.2: you have 75 seconds to fix it. Good luck.
The Blackwell systems use “blind mate” connectors, manifolds at the back of the rack that engage automatically when you slide the server chassis in. These have to be precision-engineered. A fraction of a millimeter of misalignment, or a degraded O-ring, or a speck of dust on the seal, and you are spraying coolant inside a rack that costs more than the GDP of a small island nation.
Furthermore, you now have to manage fluid chemistry. This is a new domain for IT ops.
Corrosion: Different metals in the loop (copper cold plates, aluminum radiators, brass fittings) create a galvanic cell. The coolant turns into a battery, stripping ions from one metal and depositing them on another, eating through your pipes from the inside out. You need corrosion inhibitors.
Biology: Warm water is a breeding ground for life. Algae, bacteria, and biofilms can grow in your cooling loops, clogging the micro-channels in the cold plates. Once those 50-micron channels clog, the chip overheats. You need biocides.
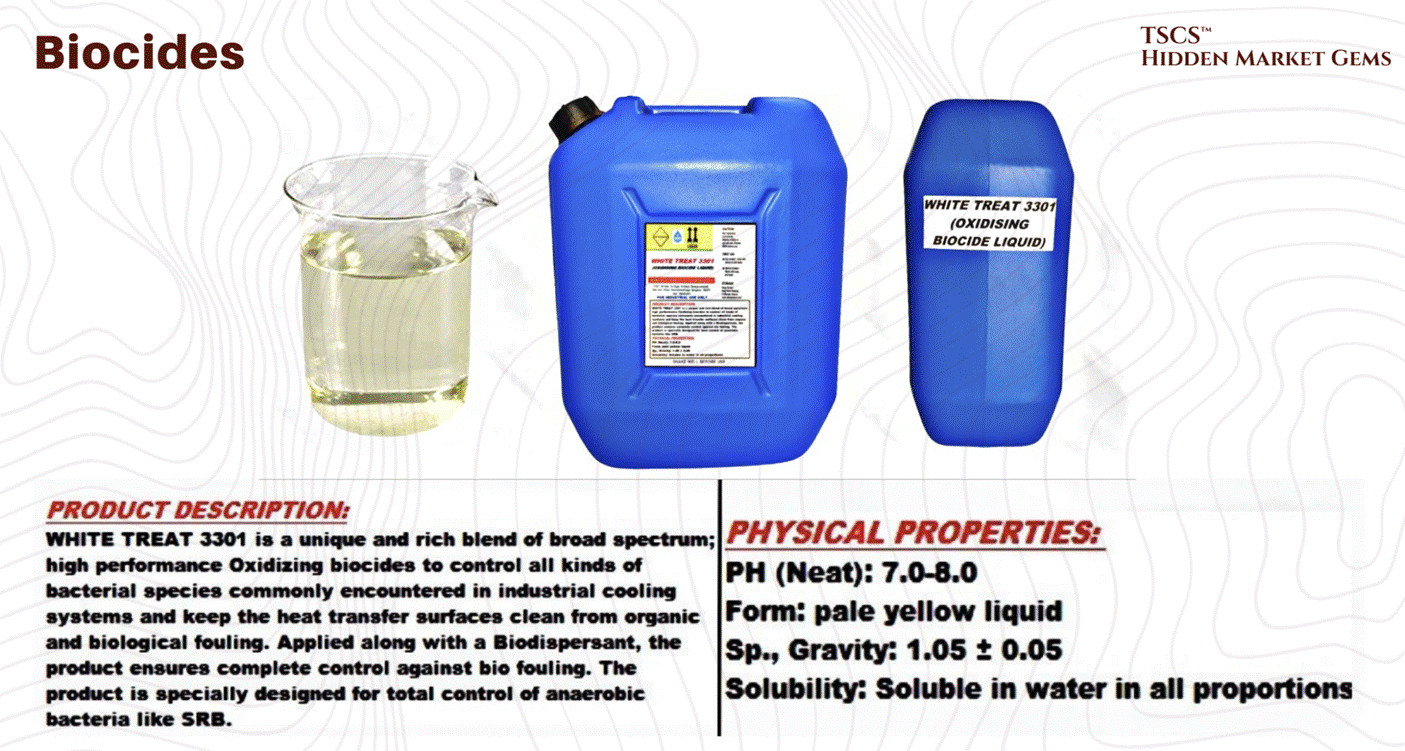
Maintenance: You have to regularly test the pH, conductivity, and biological count of your coolant.
Welcome to the world of chemistry. Put on your lab coats.
4.3 Metrics
In Operations, we love metrics. We love to put a number on a dashboard, color it green, and tell the C-suite, “Look, we are efficient.” But in the AI era, some of our favorite metrics are becoming dangerous half-truths, or worse, active obfuscations of reality.
4.3.1 PUE (Vanity Metric)
PUE (Power Usage Effectiveness) has been the gold standard for years. It’s the metric everyone knows.

Data centers have spent billions driving PUE down from the lazy days of 2.0 to the hyper-efficient 1.1s of today. They did this largely by using Evaporative Cooling, cooling towers. They spray water into the airstream to cool it down (evaporation absorbs heat) without running energy-hungry mechanical compressors.
It works beautifully for PUE. It lowers your electricity bill. It makes your dashboard look green.
But it comes at a terrible cost.
4.3.2 WUE (Hidden Cost)
Enter WUE (Water Usage Effectiveness).
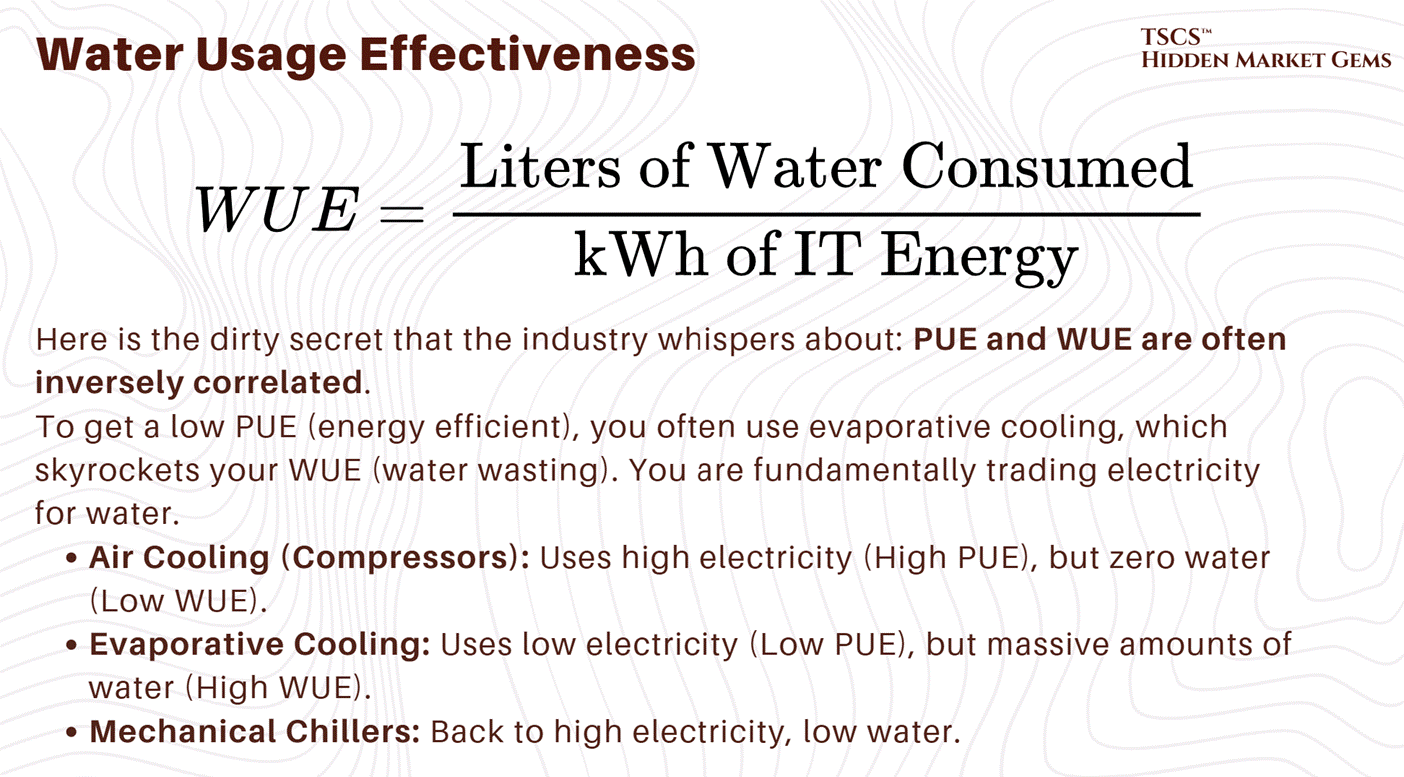
In water-stressed regions like Arizona, Utah, or parts of Spain, burning millions of gallons of potable water to keep ChatGPT cool is becoming a major political and environmental liability. You are competing with local farmers and residents for the aquifer.
Equinix, for example, reports a WUE of 1.63 for their evaporative-cooled sites (only 34% of their portfolio uses water for cooling; the company-wide WUE was 1.07 in 2023, improving to 0.95 in 2024). That is 1.63 liters of water evaporated for every kilowatt-hour of compute. Multiply that by the megawatts of a hyperscale facility running 24/7, and you are draining rivers.
We need to stop worshipping PUE. A low PUE in a desert is an environmental crime.
4.3.3 Latency
There is one metric you cannot engineer your way out of, no matter how much money you throw at it: Latency.
In the world of standard web hosting, a few milliseconds didn’t matter. In the world of High-Frequency Trading (HFT) and distributed AI training (where thousands of GPUs need to synchronize their weights in real-time), the speed of light is too slow.
But it’s worse than that, light is slower in glass than it is in a vacuum.
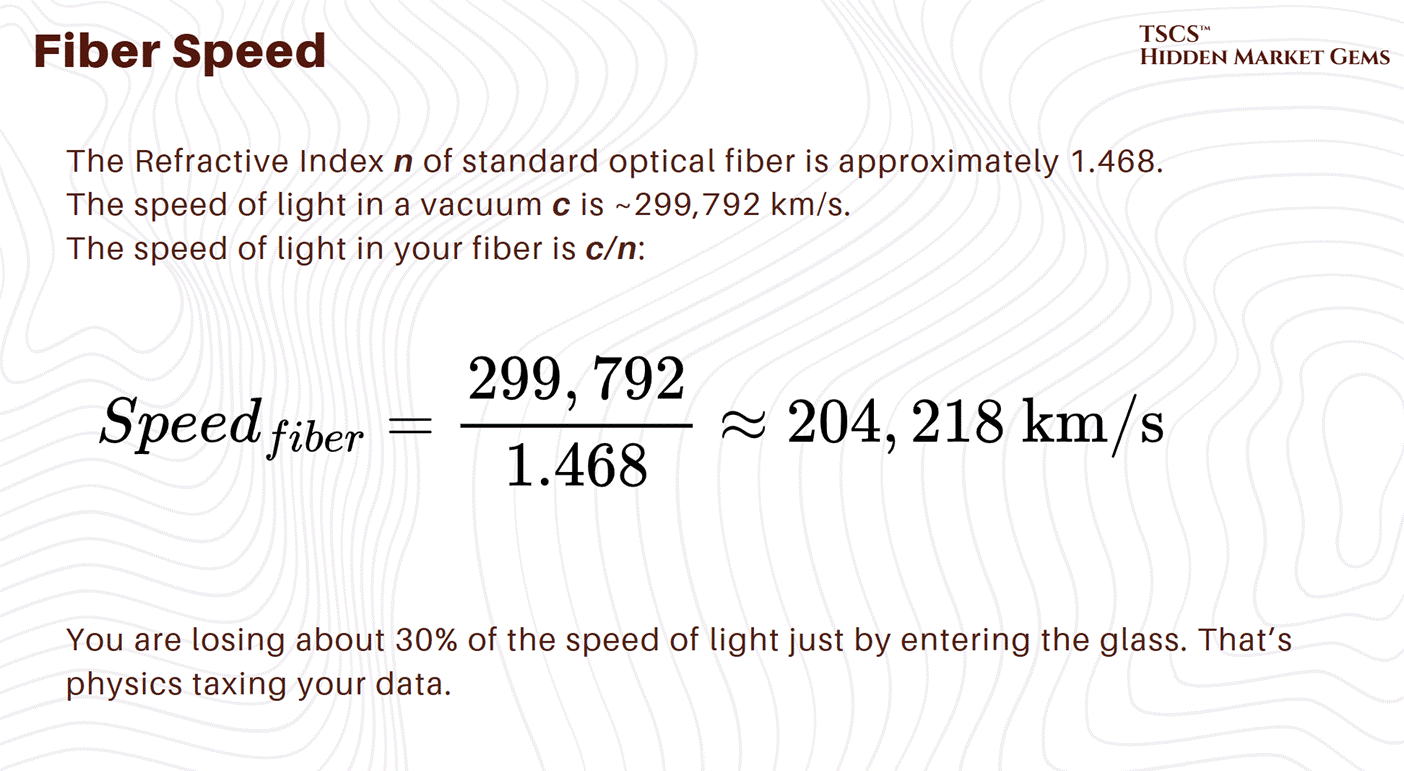
For an AI cluster training a massive model across multiple data centers (a “SuperPOD”), this latency is the hard bottleneck. If the GPUs in Building A have to wait for the gradients to arrive from the GPUs in Building B (50km away), your expensive H100s are idling. They are doing nothing. You are burning power for zero compute.
This is why we measure fiber latency with picosecond accuracy. Every meter of fiber adds roughly 5 nanoseconds of delay. This has led to the rise of “isochrones” in site selection. An isochrone is a map line that shows every point you can reach within a specific time limit (e.g., 1ms).

You aren’t just buying land anymore; you are buying proximity. You are buying a seat at the table of physics. If your data center is outside the 1ms isochrone of the carrier hotel or the cloud availability zone, you are operationally obsolete for certain workloads before you pour the first cubic yard of concrete.
4.4 Reliability
4.4.1 The Tier System
The Uptime Institute created the Tier system to classify reliability. It’s the industry standard language, even if marketing teams play fast and loose with the terminology. You need to know this cold.
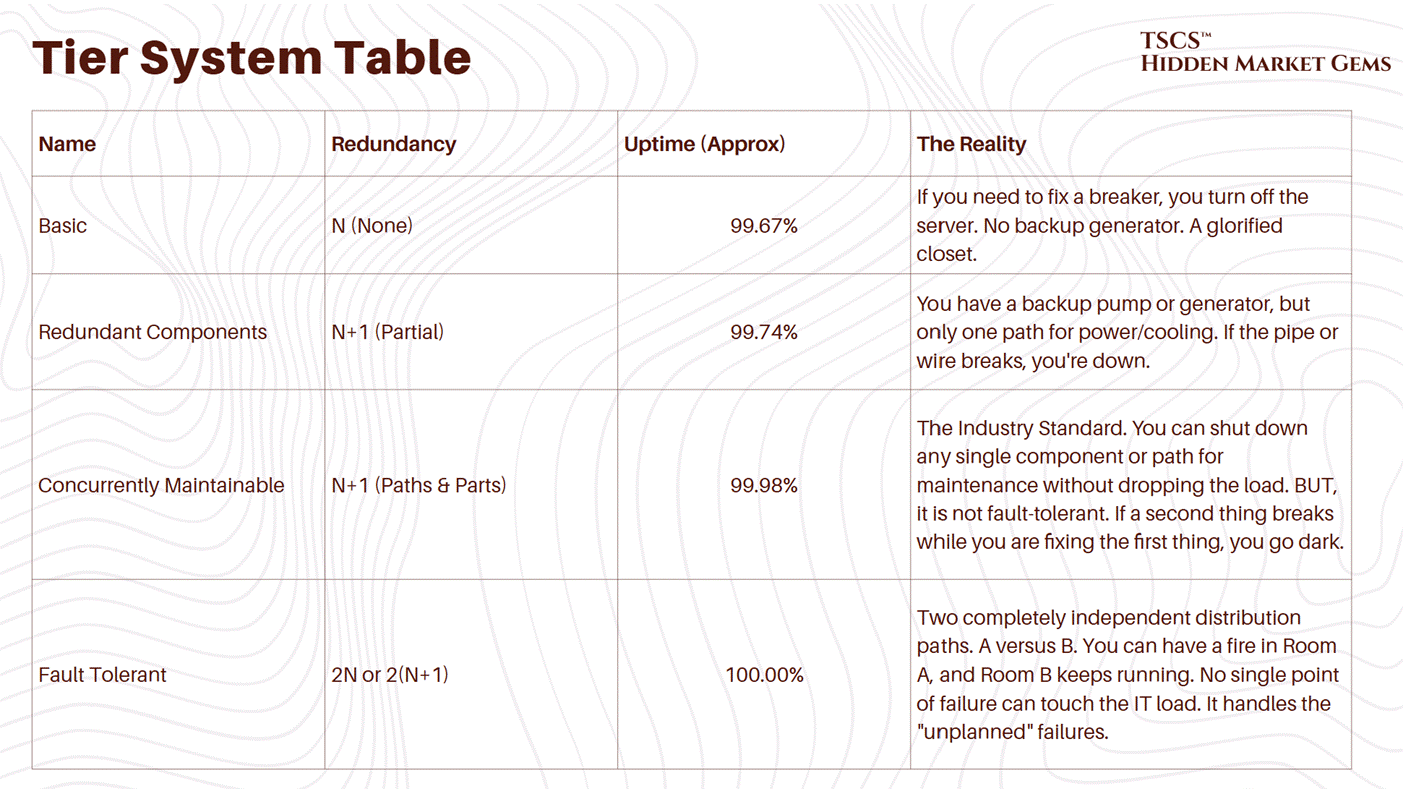
Most commercial data centers are Tier III (third row). Why? Because Tier IV is absurdly expensive. You are essentially building two data centers for the price of... well, two data centers. You double your copper, your concrete, your chillers, your generators. The ROI often isn’t there unless you are a bank or the military.
John McHugh made a great post about the limitations of Copper: “The $100 Billion Bottleneck Nobody’s Talking About.”
4.4.2 Human Error
You can build a Tier IV, gold-plated, liquid-cooled fortress. You can have dual utility feeds, backup generators for your backup generators, and a bunker mentality.
And then Dave will walk in.
Dave is a technician. He’s tired. He’s been on shift for 10 hours. He’s thinking about his divorce, or his lunch, or the football game. And he decides to run a firmware update on the primary UPS without putting the system into maintenance bypass mode first.
Click. Silence.
The fans spin down. The lights flicker. The H100s stop crunching. The silence in a data center is the loudest sound on earth. It sounds like someone setting a pile of money on fire.
Industry data is brutal on this: Human Error causes between 40% and 80% of all data center outages. The Uptime Institute reported that nearly 40% of organizations suffered a major outage caused by human error in the last three years.
We call these “Meatbag Failures.” It’s crude, but accurate. We are the softest, least reliable component in the stack.
The problem isn’t usually malice; it’s bad process. It’s the lack of a MOP (Method of Procedure).
A MOP is a script. It details every single step of an operation. It treats humans like robots.
Put on ESD strap.
Verify breaker label matches work order.
Measure voltage to ground.
Have a second person verify the voltage.
In 85% of human error incidents, the staff failed to follow the procedure, or the procedure itself was flawed/outdated. They relied on memory. “I’ve done this a thousand times,” says Dave, right before he does it wrong for the first time.
4.4.3 Case Study (RAID 10)
Let’s look at a real-world example of how “good enough” reliability fails when humans get involved. A mid-sized medical practice running Hyper-V hosts.
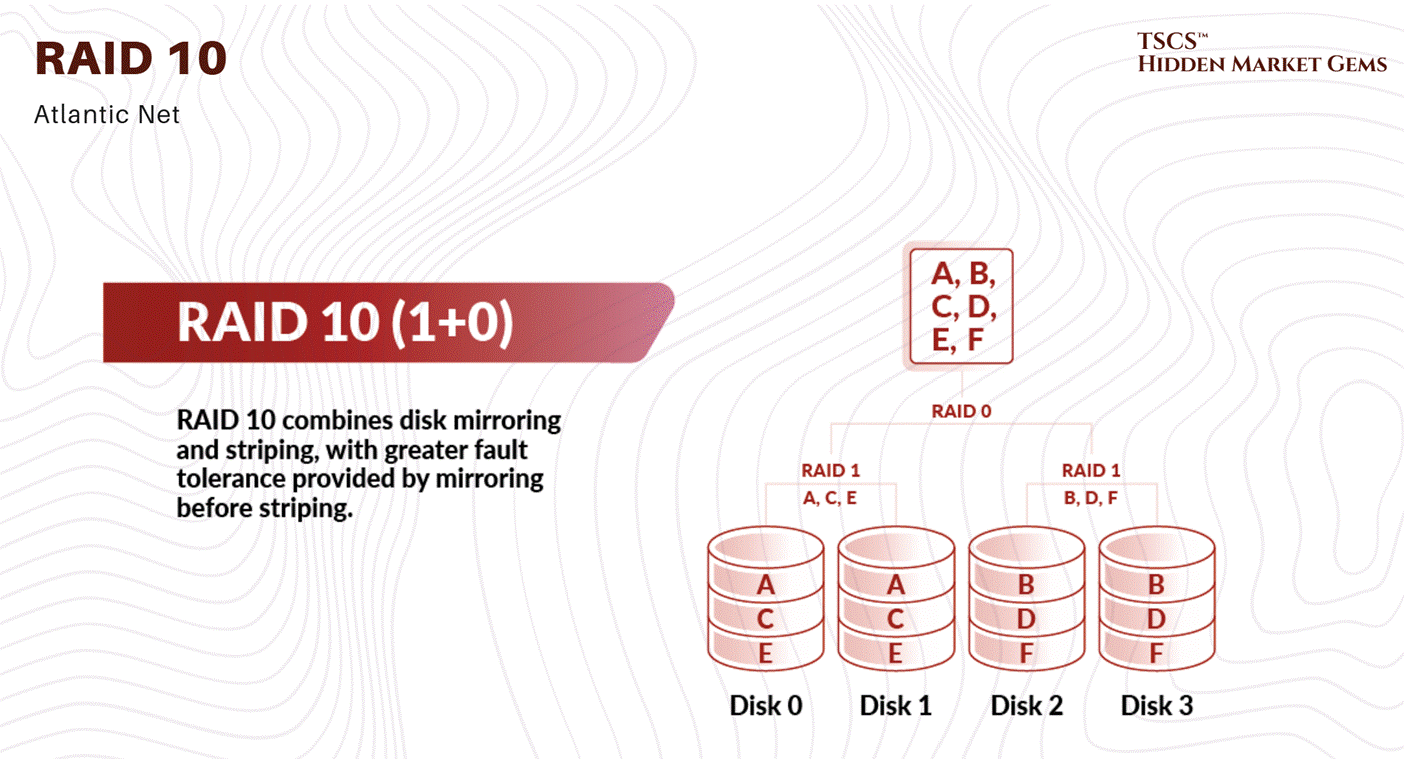
The Setup: RAID 10. This is a robust disk configuration. It mirrors data and stripes it. You can lose a drive and keep running. It’s N+1 for storage.
The Failure: One disk dies. The system sends an SMS alert.
The Human Error (Passive): The team ignores the SMS. Maybe they were asleep. Maybe they had “alert fatigue” (too many false alarms). They didn’t wake up.
The Cascade: A second disk dies. Now the RAID is degraded. The redundancy is gone. The system is limping.
The Human Error (Active): The team wakes up, panics, and tries to copy data off the failing array while it is still live. The stress of the read operations causes a third disk to fail.
The Kill Shot: Total data loss. They go to the backups. The backups fail because nobody had verified them in months. Corruption.
This wasn’t a hardware failure; the hardware did exactly what it was designed to do (alert and survive the first failure). This was an operational failure. They had the technology (RAID 10), but they lacked the operational discipline (monitoring, hot spares on the shelf, backup verification) to use it.
TSCS’ Strategist Note: Reliability is 20% hardware and 80% discipline. You can’t buy uptime; you have to earn it every day with boring, repetitive checklists.
4.5 DCIM & Protocols
Finally, we arrive at the software layer, or as I (strategist) like to call it, the “Integration Hell.”
A modern data center is a mix of two worlds that fundamentally do not understand each other: IT (Information Technology) and OT (Operational Technology).
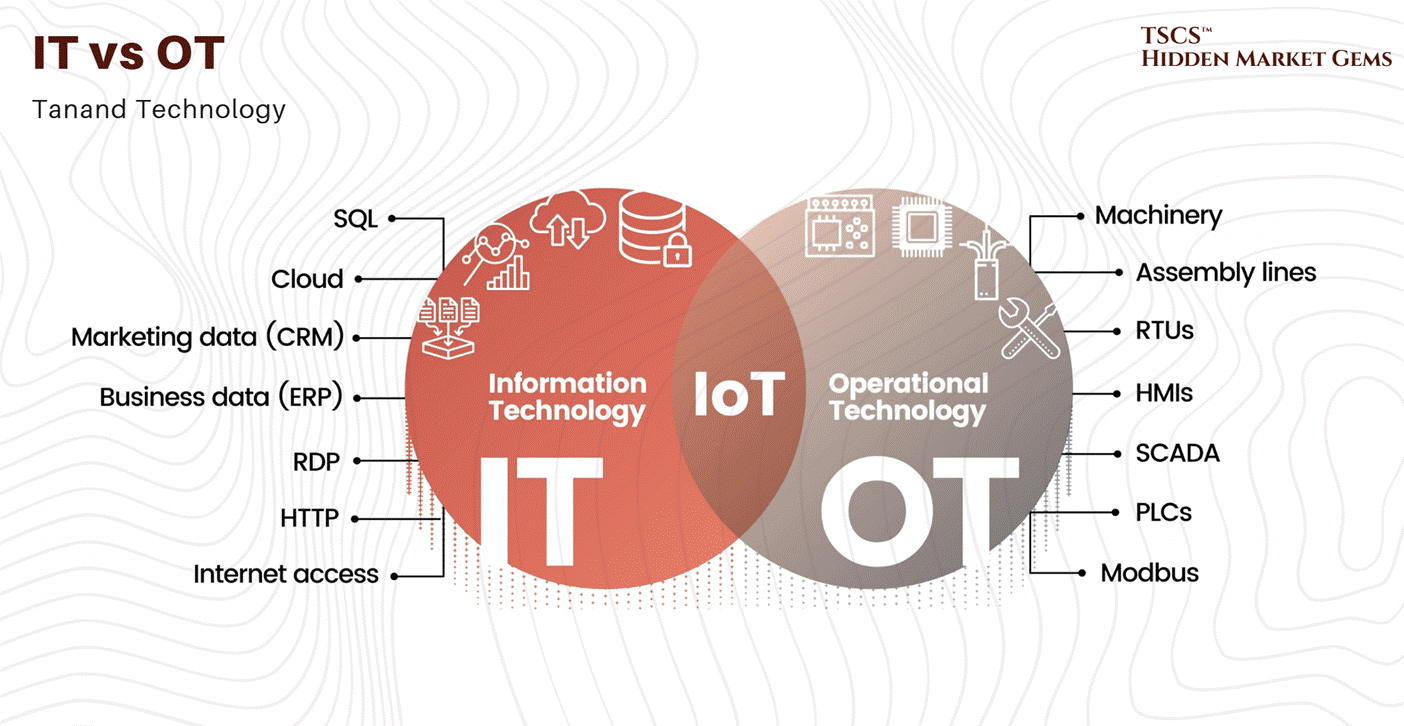
4.5.1 SNMP vs. Modbus
SNMP (Simple Network Management Protocol) is the language of IT. Your servers, switches, and routers speak it. It’s smart(ish). It has “MIBs” (Management Information Bases) that tell you exactly what each data point is. It’s discoverable. You plug a Cisco switch into the network, and it says, “Hi, I’m a Cisco Switch, here is my CPU load, here is my temperature.”
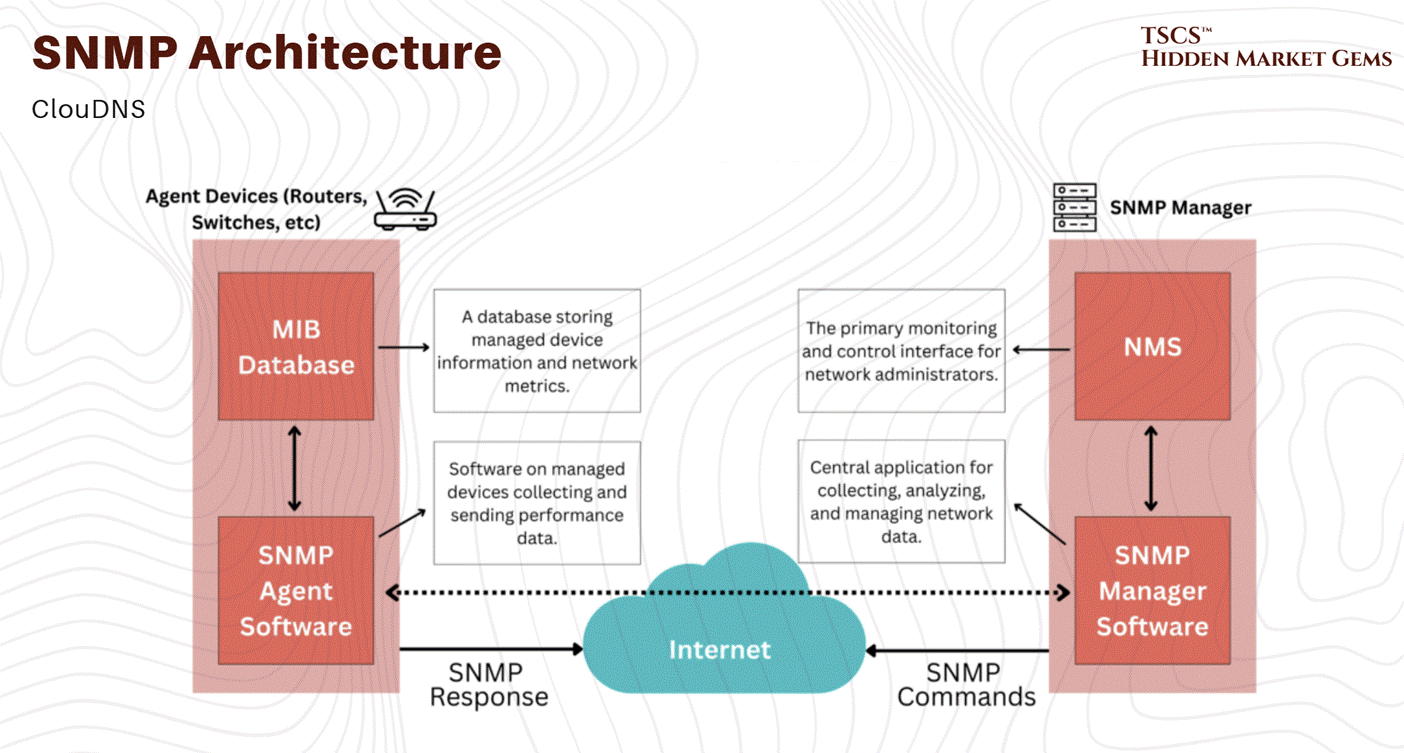
Modbus is the language of OT. It was invented in 1979 by Modicon. It is the language of chillers, pumps, generators, and power meters.
Modbus is... stupid. It is a master-slave protocol. It doesn’t know what it is. It just has “Registers.”
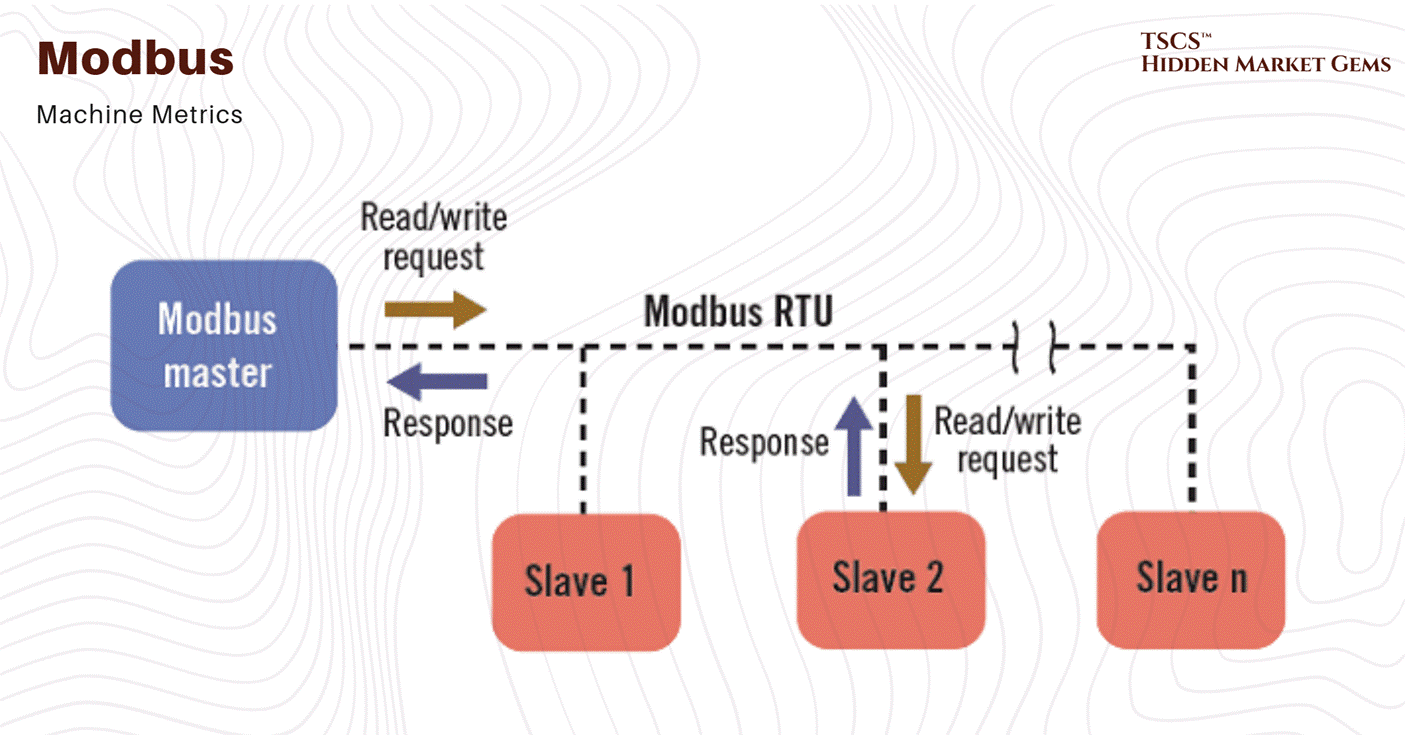
You ask a Modbus device: “Give me the value in Register 4001.”
It replies: “1024.”
Is that 1024 degrees? 1024 Volts? 10.24 Amps? Or is it an error code?
The device doesn’t know. You have to know. You need a “Register Map”, a PDF document from the vendor that tells you what Register 4001 means.
4.5.2 The Integration Nightmare
DCIM (Data Center Infrastructure Management) software is supposed to bring these two worlds together. It needs to pull data from the SNMP IT gear and the Modbus facilities gear into a single “pane of glass” dashboard.
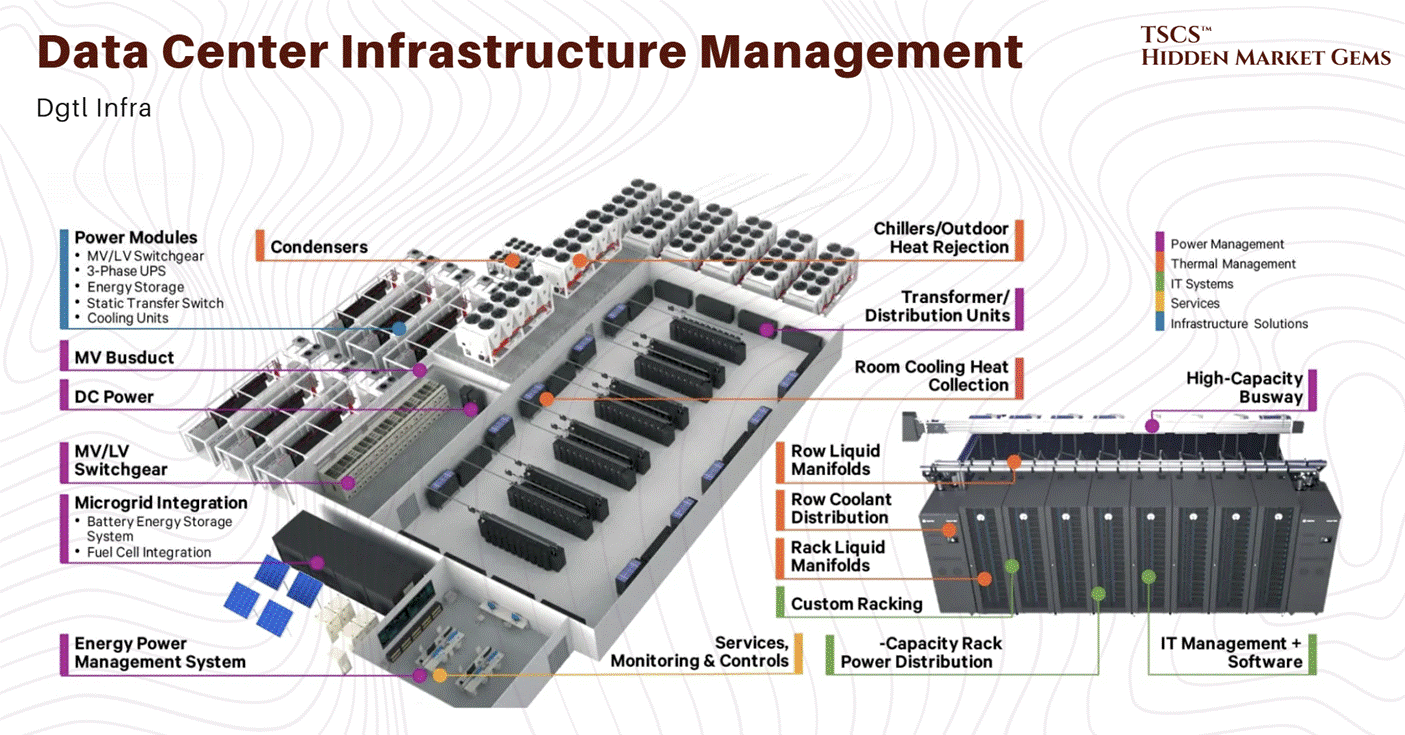
This is where the pain starts.
Protocol Translation: You often need hardware gateways to translate Modbus Serial (RS-485), which uses two copper wires and 1980s serial communication, to Modbus TCP (Ethernet) or SNMP. These gateways are cheap, flaky, and represent a single point of failure. If the gateway locks up, you lose visibility into your cooling plant.
The Register Map Shuffle: Every time you buy a new generator or upgrade the firmware on your UPS, the register map might change. If the vendor moved “Fuel Level” from Register 4001 to 4002, your dashboard now shows you “Oil Pressure” instead of “Fuel.” You see “50%” and think you have fuel. In reality, you have 50 PSI of oil pressure, and your tank is empty. You won’t know until the generator dies.
Vendor Lock-in: Vendors like Vertiv or Schneider want you to use their full stack. They want you to buy their UPS, their cooling, their PDU, and their software. If you do, it works. The moment you buy a third-party sensor because it’s cheaper or better? You are back in integration hell.
4.5.3 The Niagara Solution
One of the few things that keeps us sane is the Niagara Framework (Tridium). It acts as a universal translator, middleware that can speak BACnet, Modbus, SNMP, and LON, normalizing all that garbage data into a standard object model.
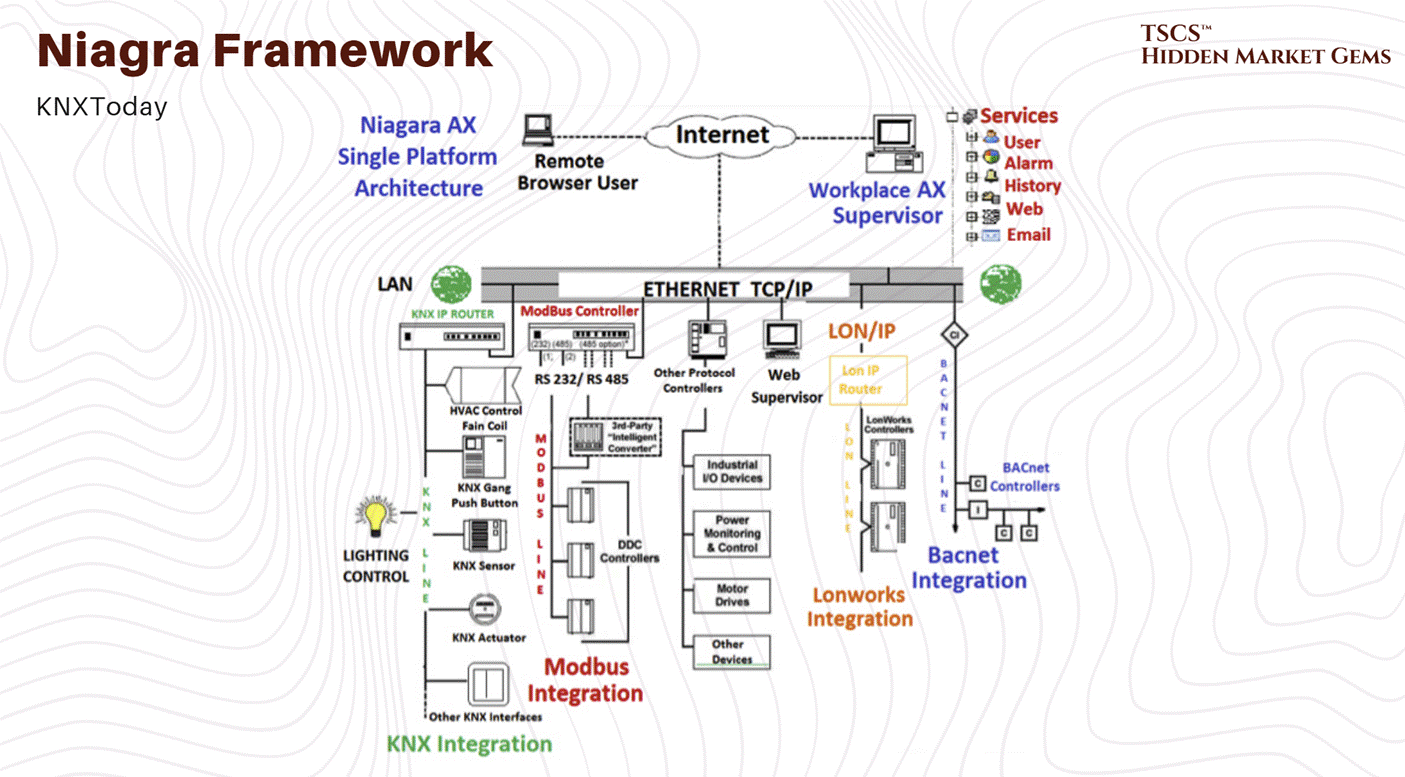
It abstracts the stupidity of the underlying protocols. It allows you to say “Get Generator Fuel Level” instead of “Read Register 4001.” It’s the duct tape that holds the modern smart building together. Without it, or something like it, you are just looking at a thousand disconnected spreadsheets and guessing.
Module 5: Industry Ecosystem
5.1 The Business Ecosystem
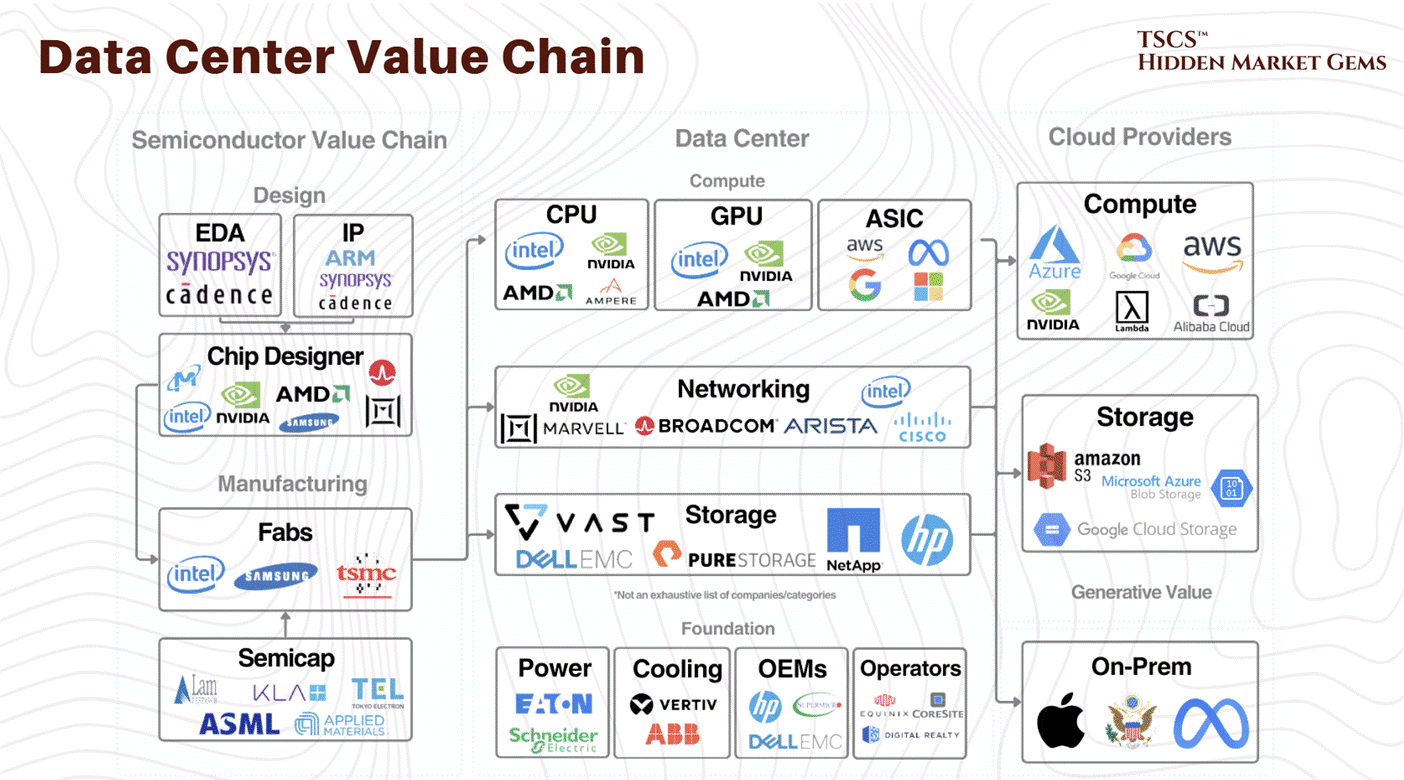
The data center sector is an ecosystem of cloud providers, colocation REITs, chip manufacturers, and infrastructure vendors for power, cooling, and networking.
Economic value flows through CapEx, when hyperscalers build and expand capacity, and OpEx, when they pay ongoing power, cooling, and maintenance, creating recurring revenues for operators and suppliers.
5.2 The AI Imperative
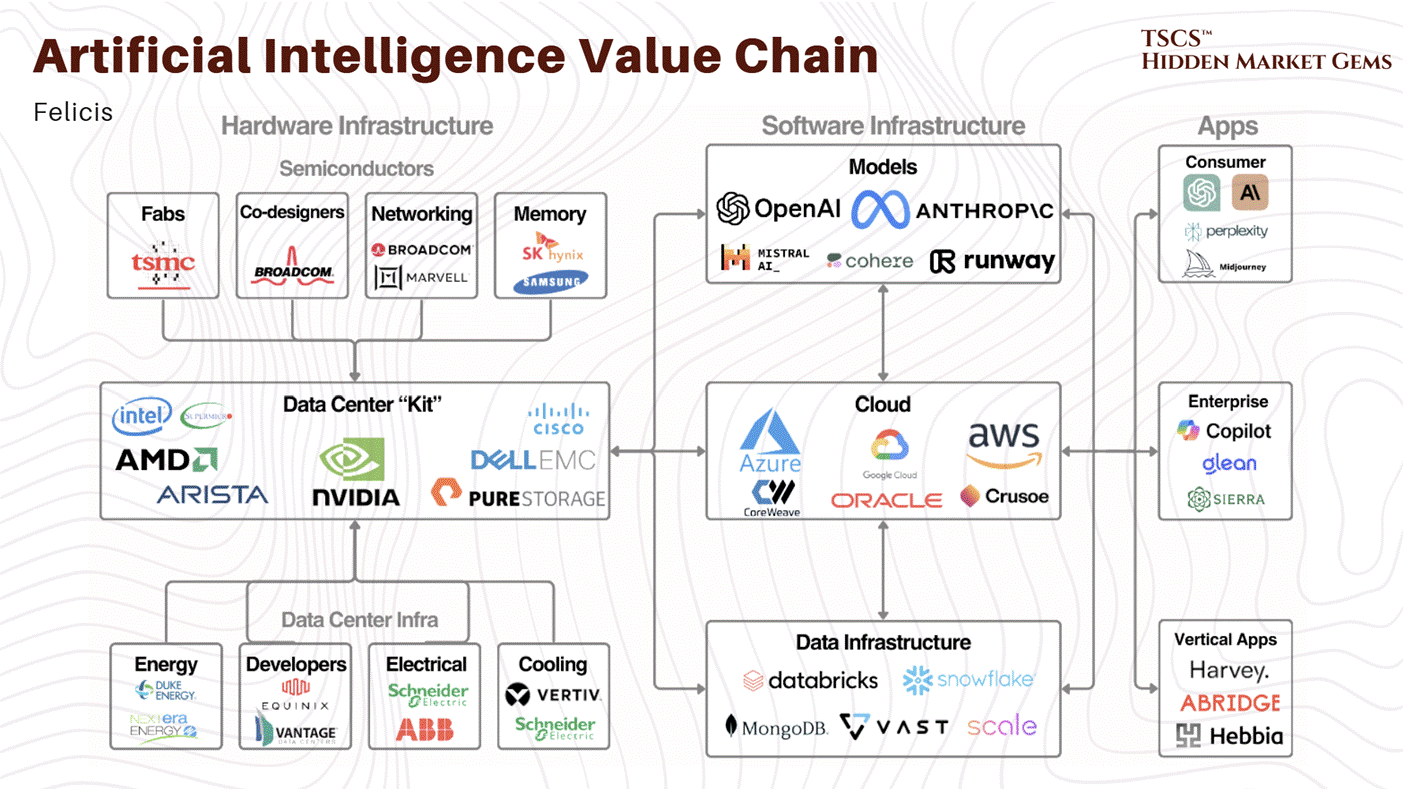
Commercial AI models now require massive compute for both training and inference, far beyond what legacy general‑purpose facilities were designed to support.
This drives a shift to GPU‑dense racks, much higher power per rack, advanced cooling, and low‑latency networking, turning data centers into the “factories” where AI models are produced and deployed.
5.3 Hype Cycles vs. Real Demand
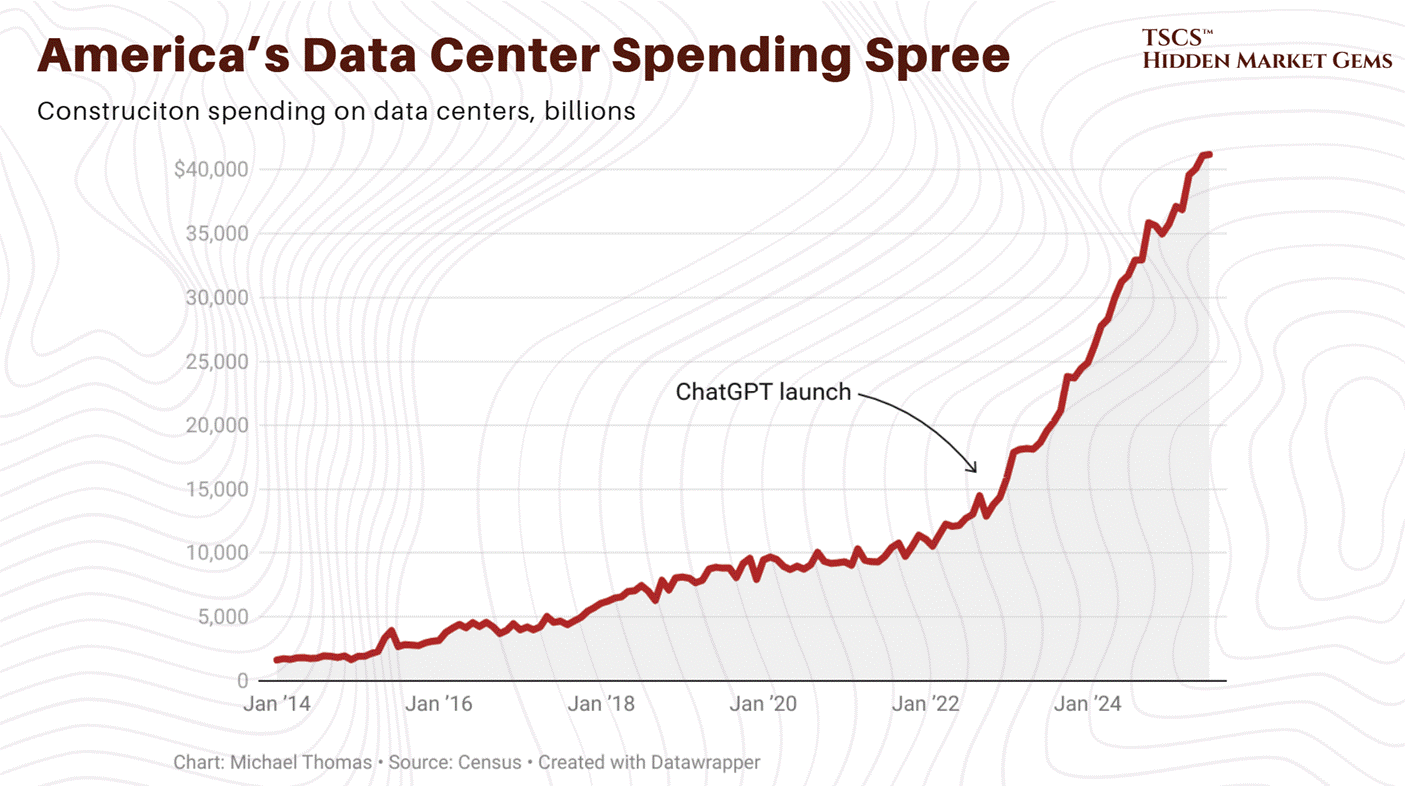
The recent pullback in many data‑center‑linked stocks reflects the fading of the first AI hype wave more than any collapse in physical infrastructure.
Despite sentiment swings around AI applications, forecasts still call for strong growth in AI‑ready capacity through the decade, suggesting the infrastructure build‑out remains in an early, structural upcycle rather than nearing its end.
Module 6: Future Trends and Sustainability
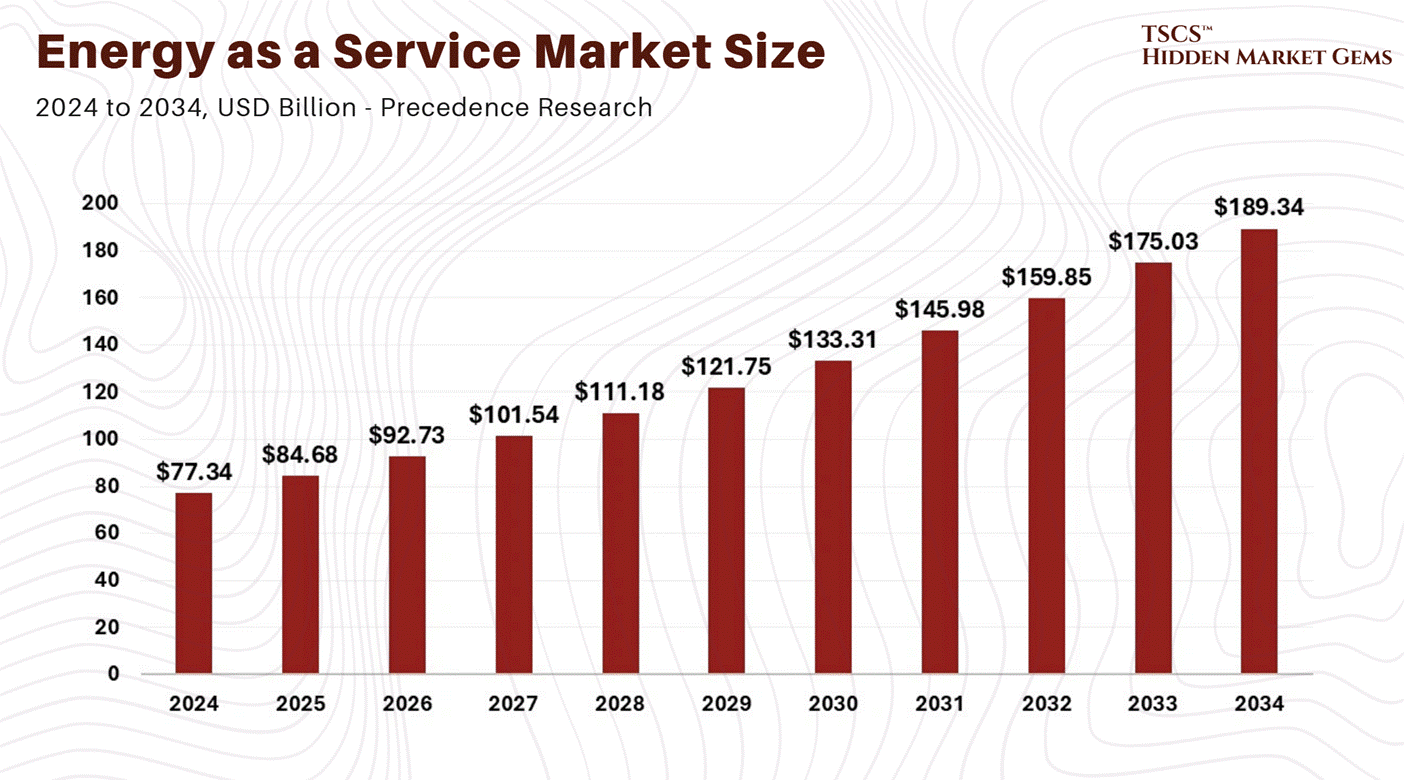
The coming decade will be defined by the twin constraints of energy and scalability, forcing data centers to innovate across power sourcing, efficiency, and architecture...
6.1 Sustainability and Energy Challenges
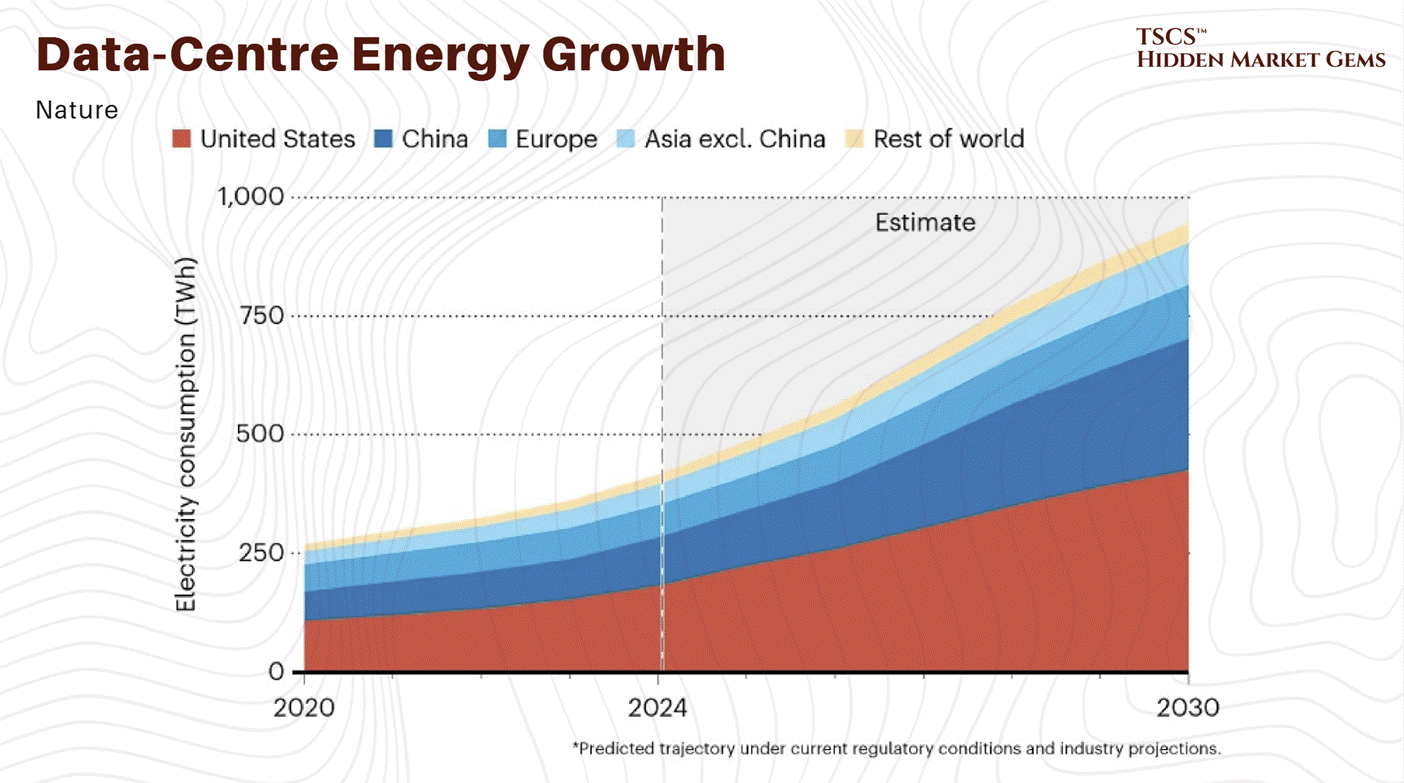
Data centers already account for a fast‑rising share of global electricity demand, and AI could push usage significantly higher by 2030, making net‑zero strategies non‑negotiable for large operators. Leading hyperscalers have set 24/7 carbon‑free or net‑zero targets by 2030, tying infrastructure expansion directly to decarbonization roadmaps.
To square growth with climate goals, operators increasingly sign long‑term Power Purchase Agreements (PPAs) with wind, solar, and storage developers, using their stable load to underwrite new renewable capacity. Yet grid interconnection delays and transmission constraints are emerging as hard bottlenecks, pushing exploration of alternative or complementary generation options such as small modular reactors and hydrogen‑based backup or primary power systems.
[February 2026 Update: Nuclear commitments from big tech have crossed the 10 GW threshold, fundamentally changing the scale of what was a speculative narrative twelve months ago. Meta’s January 9, 2026 announcement was the inflection point: agreements with TerraPower, Oklo, and Vistra for up to 6.6 GW of energy over 20 years, including 2.1 GW from existing Vistra plants, a 1.2 GW Oklo campus in Ohio (first phase by 2030), and 690 MW from two TerraPower reactors (first delivery by 2032). Combined with its prior Constellation deal, Meta became “one of the most significant corporate purchasers of nuclear energy in American history.”
Total big tech nuclear commitments: Meta at roughly 7.7 GW, Amazon at 5+ GW target (via X-energy and others), Google at roughly 1.3 GW confirmed (Kairos Power 500 MW, NextEra/Duane Arnold 615 MW, CFS ~200 MW) with additional capacity under exploration, Microsoft at roughly 835 MW (Crane Clean Energy Center plus Helion fusion), and Oracle at approximately 1 GW (vendor TBD).
The constraint is no longer demand or willingness to sign contracts. It is execution. The Palisades nuclear restart faces new obstacles: an NRC meeting on February 9, 2026 revealed missing welding safety documentation, compounding concerns about thousands of cracked steam generator tubes discovered in 2024. And the bottleneck that spans every SMR project is fuel: domestic HALEU supply stands at roughly 1 metric ton produced against a need for 40 tons by end of decade and 3,500 to 7,200 MT by 2050. The nuclear thesis is real. The nuclear timeline is a different question entirely.]
6.2 Technological Innovations
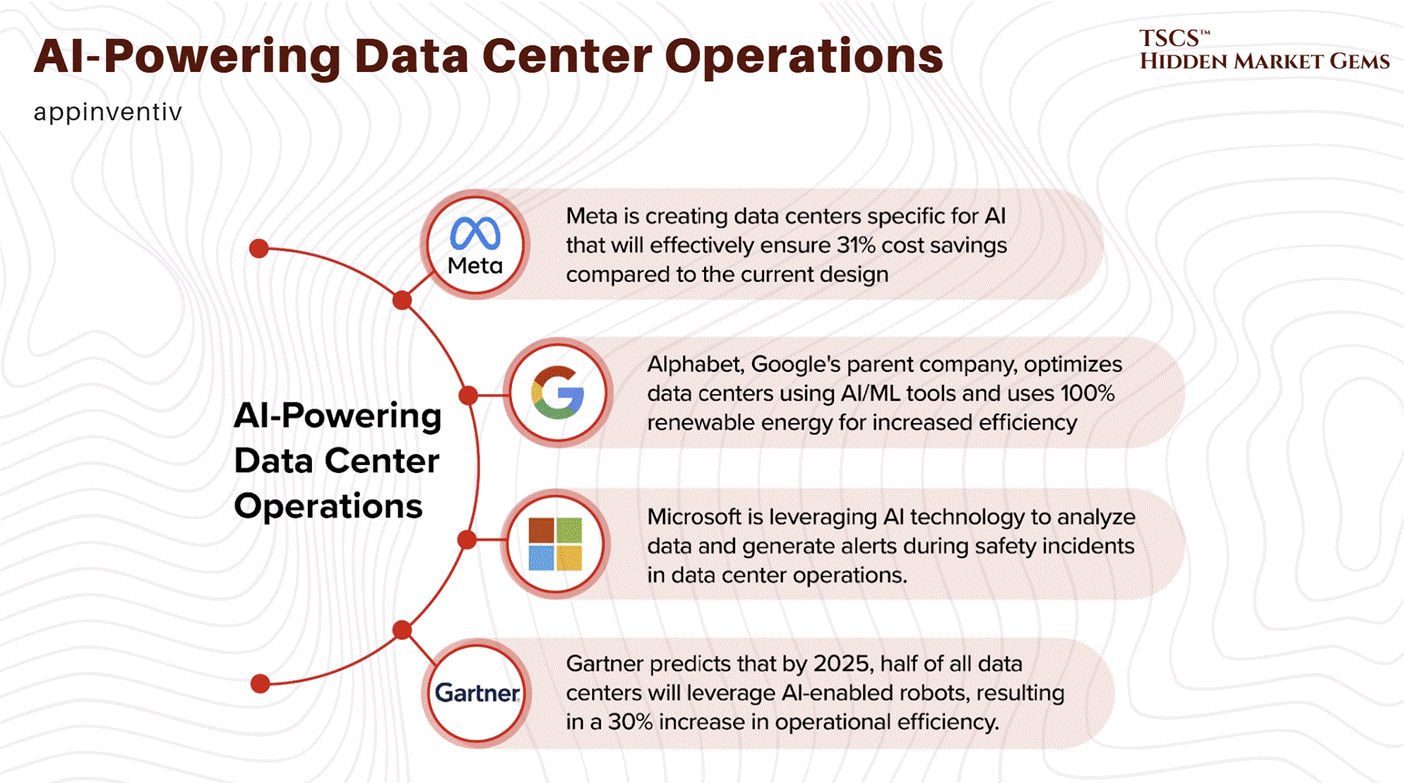
Operationally, AI is feeding back into the data center itself: autonomous control systems and predictive maintenance models are optimizing cooling, workload placement, and failure detection to cut energy and downtime. This software layer will increasingly determine the effective capacity and efficiency of a given megawatt of installed power.
On the hardware side, silicon photonics and co‑packaged optics are emerging to replace or augment copper interconnects, boosting bandwidth while reducing latency and power per bit moved inside and between data centers.
→ In parallel, modular and prefabricated data center designs, factory‑built power and IT blocks assembled on‑site, are shortening deployment timelines and enabling capacity to be added in smaller, repeatable increments aligned with AI demand ramps.
Again, Robert Bryce covered this very professionally in his post “The Data Center Backlash Is Global.”
Module 7: Equity Research and Investment Analysis
This module focuses on applying the technical knowledge of data centers to financial markets, identifying where value is created and captured across the industry’s “production process.”
TSCS’ Strategist Note: Do not view the Data Center industry as a monolith. It is a vertical economy. The company that sells the shovel (Infrastructure) has a completely different risk profile than the company digging for gold (Semiconductors) or the landlord owning the mine (REITs).
7.1 The Silicon Stranglehold
If you spend five minutes on any tech forum (be it Reddit, Hacker News, or a specialized discord) you’ll hear someone claiming that Nvidia’s monopoly is fragile. “Open source will win!” they shout. “ZLUDA will save us!” “AMD is catching up with ROCm!”
Let’s be real: this is wishful thinking bordering on delusion. The evidence suggests that trying to break Nvidia’s stranglehold with open-source tools in the current climate is like trying to storm a castle with a wet noodle. The core problem isn’t that the hardware is unbeatable; it’s that the software ecosystem is a labyrinth designed to keep you trapped, and the walls of that labyrinth are made of ten years of accumulated code debt.
Nvidia’s “moat” is built on CUDA (Compute Unified Device Architecture). It’s proprietary. It’s closed. And crucially, it works. The alternative, OpenCL, has been a disaster for over a decade. OpenCL 2.0 came out nearly ten years ago, and Nvidia still doesn’t support it properly. Why would they? Why would a company with a dominant market position make it easier for you to leave? They sabotaged it by neglect, and the rest of the industry was too disorganized to fix it.
[February 2026 Update: The CUDA moat is showing its first structural cracks, though it remains formidable. AMD announced the Instinct MI400 series at CES 2026 on TSMC's 2nm process (the first GPUs on this node), with HBM4 memory and UALink interconnect support. Most significantly, AMD confirmed a 6 GW GPU supply deal with OpenAI (where 6 GW refers to the total power consumption capacity of the GPU systems to be deployed, reflecting the industry’s shift to power as the primary metric for AI infrastructure deals), delivery beginning H2 2026. On the software side, OpenAI's Triton compiler continues gaining traction as the most significant open-source challenge to CUDA, generating PTX code directly and achieving performance matching cuBLAS in certain operations. PyTorch 2.0's Inductor backend increasingly abstracts away CUDA dependency. SemiAnalysis characterized these developments as "permanently weakening" NVIDIA's software moat. That said, NVIDIA retains 85 to 92% GPU market share, CUDA's ecosystem depth remains several years ahead of any competitor, and the developer inertia is real. The moat is eroding, not collapsing. The question is the rate of erosion.]
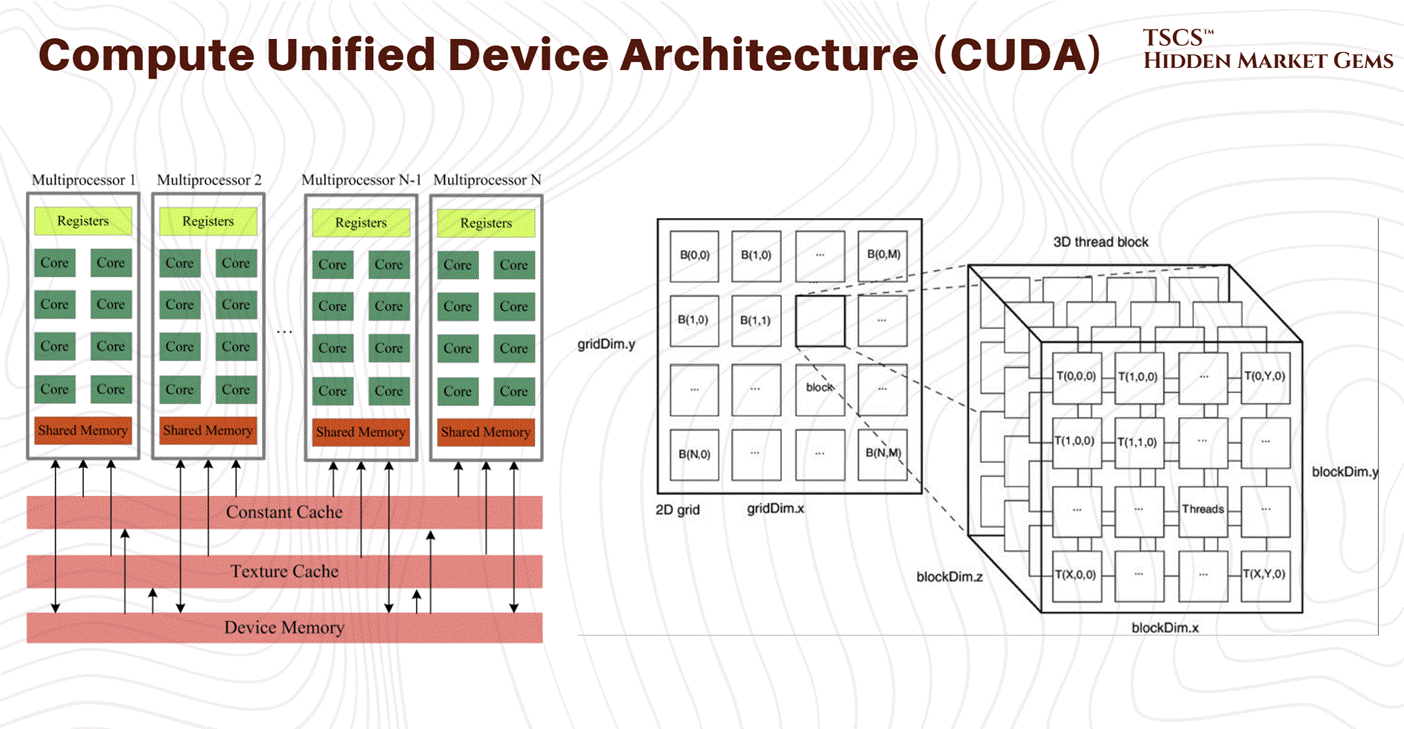
This sabotage wasn’t necessarily active malice in every instance, but rather a strategic apathy. Support for OpenCL was “spotty and inconsistent” across all vendors, not just Nvidia. While developers theoretically want an API that isn’t vendor-locked, an egalitarian utopia of code that runs anywhere, the reality is that businesses want something that runs today. They don’t have time to debug driver issues on an AMD card just to save a few bucks on hardware. In the AI arms race, the most expensive commodity is not silicon, and it certainly isn’t electricity, it is time.
The failure of ZLUDA, a project attempting to run CUDA on non-Nvidia hardware, is a perfect case study. Even if you white-room reverse engineer the API, you are chasing a moving target. As noted by industry observers, keeping it closed source won’t stop people from trying to emulate it, but it strengthens the moat because the emulation is always a step behind. You will never keep up with Nvidia implementing new functions or changing how things are implemented at the driver level. It is a Sysyphean task.
7.1.2 The Turnkey Trap
Here is the calculus of the enterprise: Migration is expensive. Refactoring code takes time. If you are a startup burning venture capital at a rate of a million dollars a month, or a Fortune 500 company trying to ship a Large Language Model (LLM) before your stock price tanks, you do not care about “software freedom.” You care about “does it run?”
Nvidia and Google are the only two entities that matter in the library space. They have the most engineers working on libraries. The ecosystem is roughly 90% Nvidia, 9.5% Google (TPUs/XLA), and a rounding error for everyone else (AMD, Intel, etc.). Data scientists don’t want to spend their days debugging framework issues or figuring out why PyTorch is segfaulting on an obscure accelerator; they want to build models.
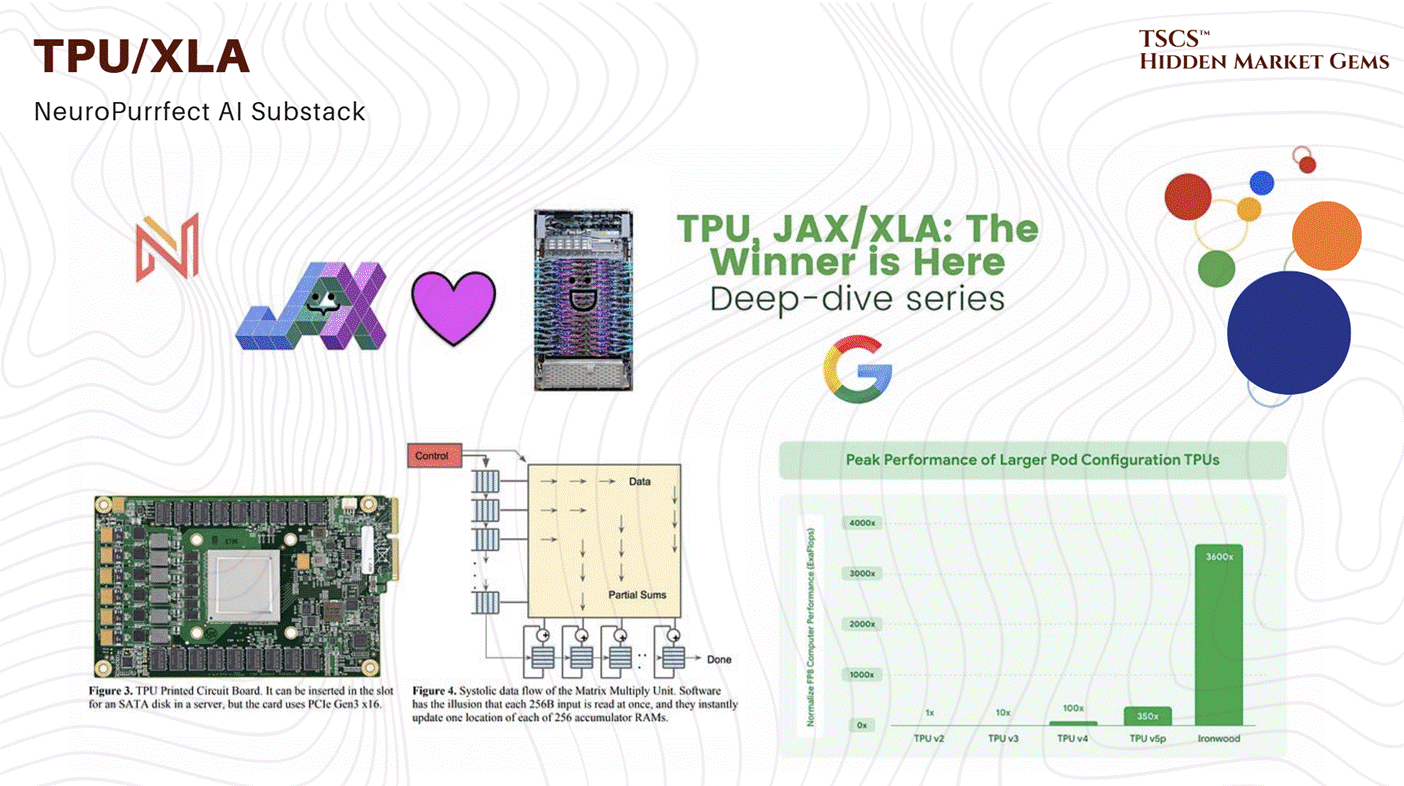
If a solution takes six months to refactor for a different architecture, that’s six months of lost lead time. In a market moving at exponential speed, six months isn’t just a delay; it is an eternity. It is death. It is the difference between being OpenAI and being a forgotten footnote.
Is the lock-in impenetrable? Maybe not technically. Large multinational companies actually encourage reducing vendor lock-in because they hate being squeezed on margins and hate having a single supplier dictate terms. They have the budget to task teams with exploring alternatives. Universities, lacking the budget for massive H100 clusters, are forced to experiment with AMD hardware, slowly building up a talent pool that knows something other than CUDA. But this is a slow, grinding process. The “turnkey” solution, the plug-and-play Nvidia system, is still king because it solves the immediate, burning problem of speed to market.
7.1.3 The Custom Kernel Myth
You’ll often hear tech-bros and optimization nerds brag about writing “custom CUDA kernels” to beat Nvidia’s libraries. They claim they can squeeze out an extra 5% performance by bypassing cuBLAS or cuDNN. This is mostly ego-stroking bullshit.
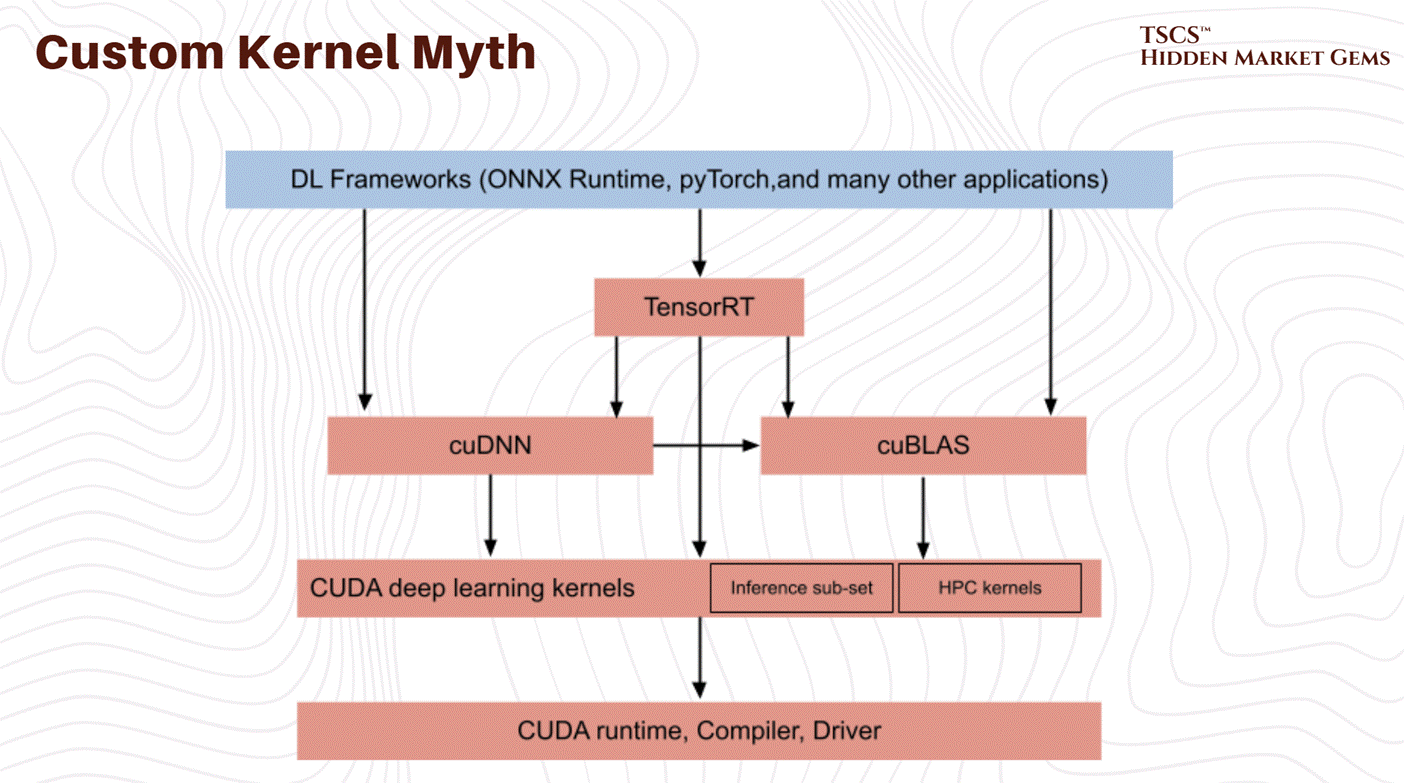
Nvidia spends billions paying software engineers to optimize their backends. The idea that a random developer is going to write a matrix multiplication kernel in their basement that consistently beats Nvidia’s own highly-paid, PhD-laden team is laughable.
In machine learning, there are really only about three types of layers that people use heavily:
Matrix multiplication-y things (Convolutions, Linear layers).
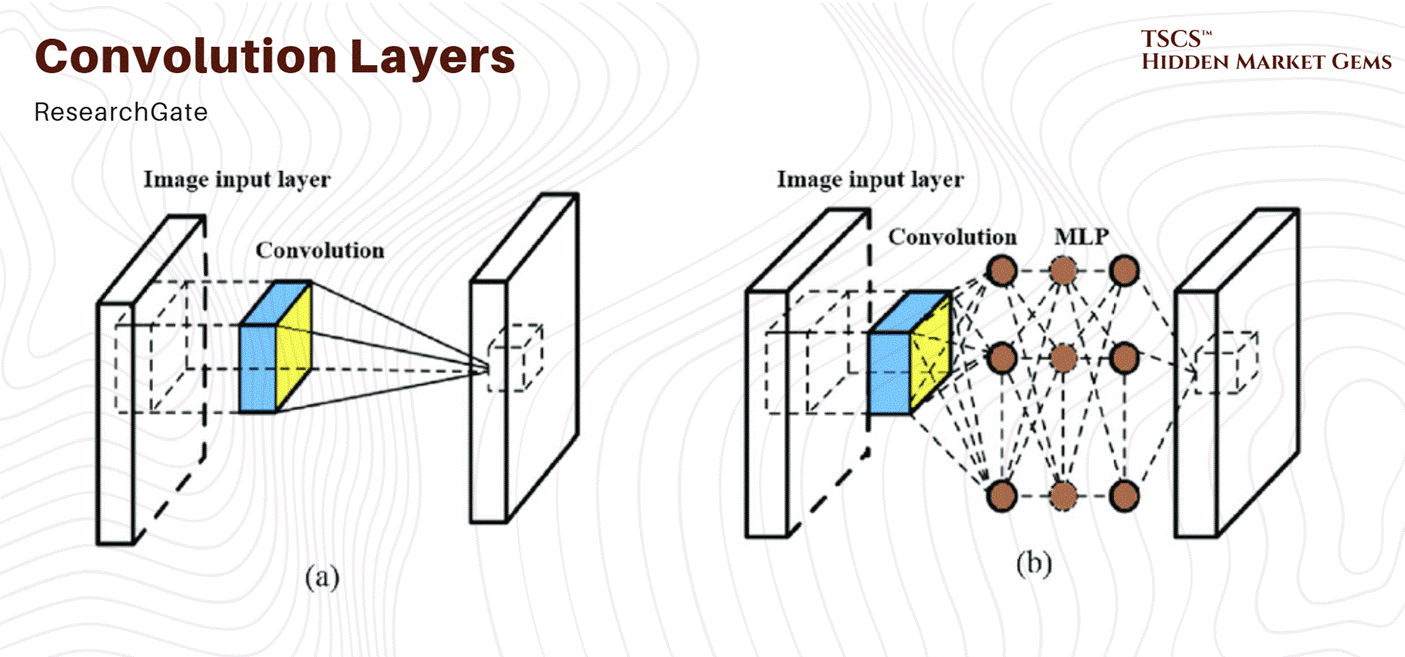
Normalization (LayerNorm, BatchNorm).
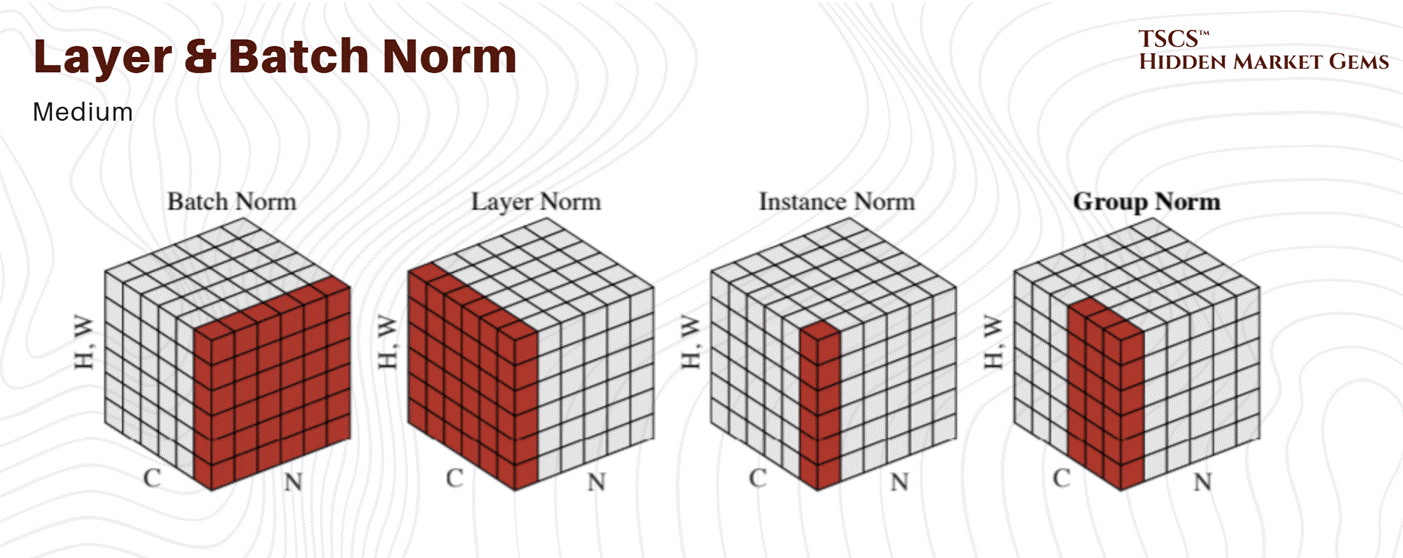
Element-wise activation functions (ReLU, GELU, SiLU).
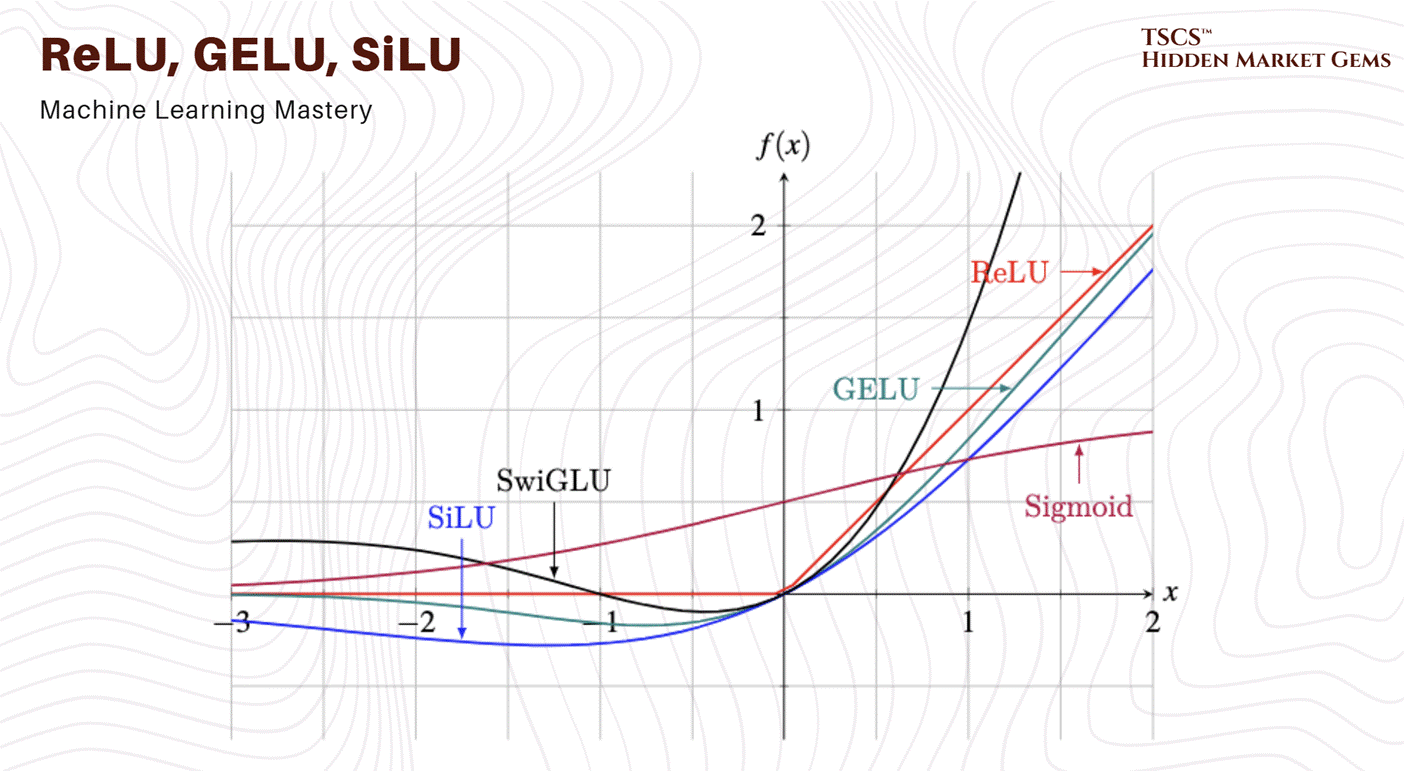
Nvidia has optimized the absolute hell out of these. They have written kernels that are tuned for the specific cache sizes, memory bandwidth, and instruction sets of every GPU generation they release. Unless you are doing something incredibly niche, you will never beat Nvidia’s implementations on these standard operations.
And even if you do beat them, what have you gained? You’ve created a piece of unmaintainable, brittle code that breaks the moment the driver updates or the hardware generation changes. The only real way to “beat” them is to change the math entirely, to fuse operations so you don’t have to call their functions twice (kernel fusion). But even then, Nvidia is watching. They see what the research community is doing, and they will just add that fusion to the next library release, rendering your custom kernel obsolete.
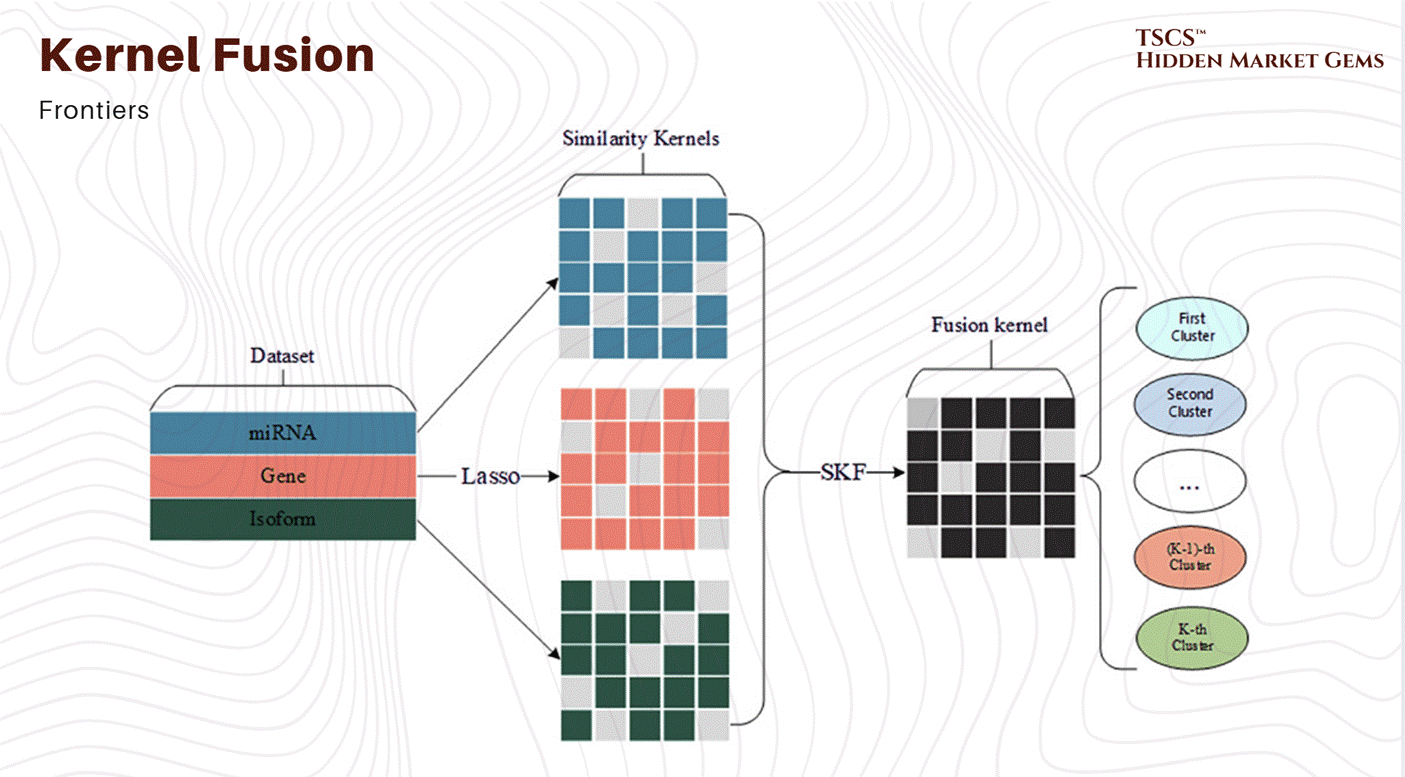
The moat isn’t just hardware excellence. It’s the fact that they have already done the hard, boring work of optimization, and you are too lazy (or smart) to redo it.
7.2 Networking & Storage
Moving down the stack from the application layer, we hit the interconnects. This is the nervous system of the data center, where servers talk to each other to coordinate the massive parallel calculations required for AI. In high-performance computing (HPC) and AI clusters, this is currently a brutal war between Infiniband and Ethernet.
7.2.1 InfiniBand
Infiniband is the Ferrari of networking: it is incredibly fast, offers extremely low latency, and is a total pain in the ass to maintain. If you are a sysadmin tasked with rebuilding a cluster (say, migrating an operating system from EL7 to EL8) you are going to run into the esoteric nightmare of subnet managers and PKEY partitions.
You might find yourself staring at documentation asking, “Do I need a sub-interface for each partition?” The answer is usually buried in a RedHat document from five years ago or a forum post that hasn’t been updated since the Obama administration. And let’s be clear about one thing: IPoIB (IP over Infiniband) sucks.
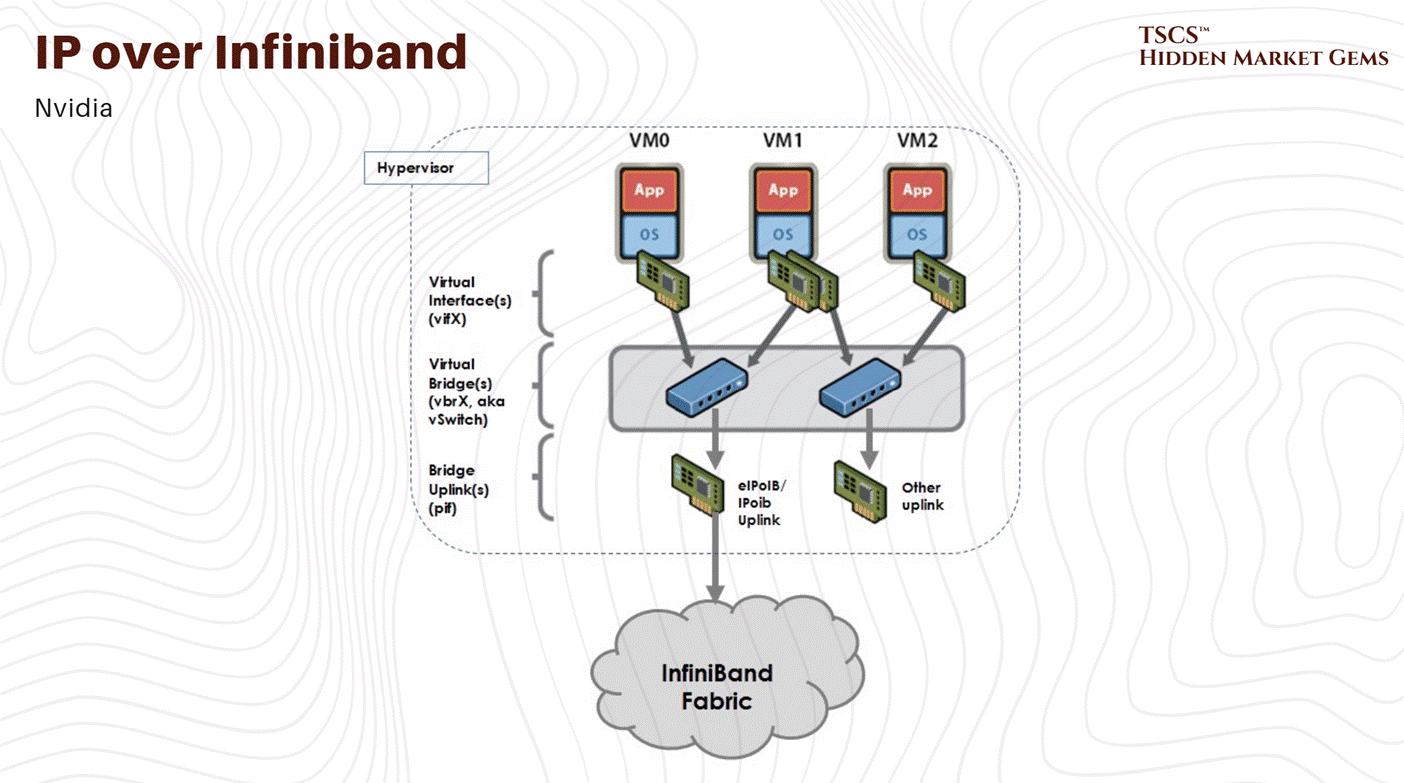
IPoIB is a hack. It tries to make Infiniband look like standard Ethernet so that applications that don’t know any better can still use the network. But it is inefficient. It adds overhead. You need it for addressing and bookkeeping (so the machines can find each other) but if you are using it for actual heavy data traffic, you are doing it wrong. You should be using RDMA (Remote Direct Memory Access), which allows one computer to access the memory of another without involving the CPU or the OS kernel. This is the magic that makes Infiniband fast.
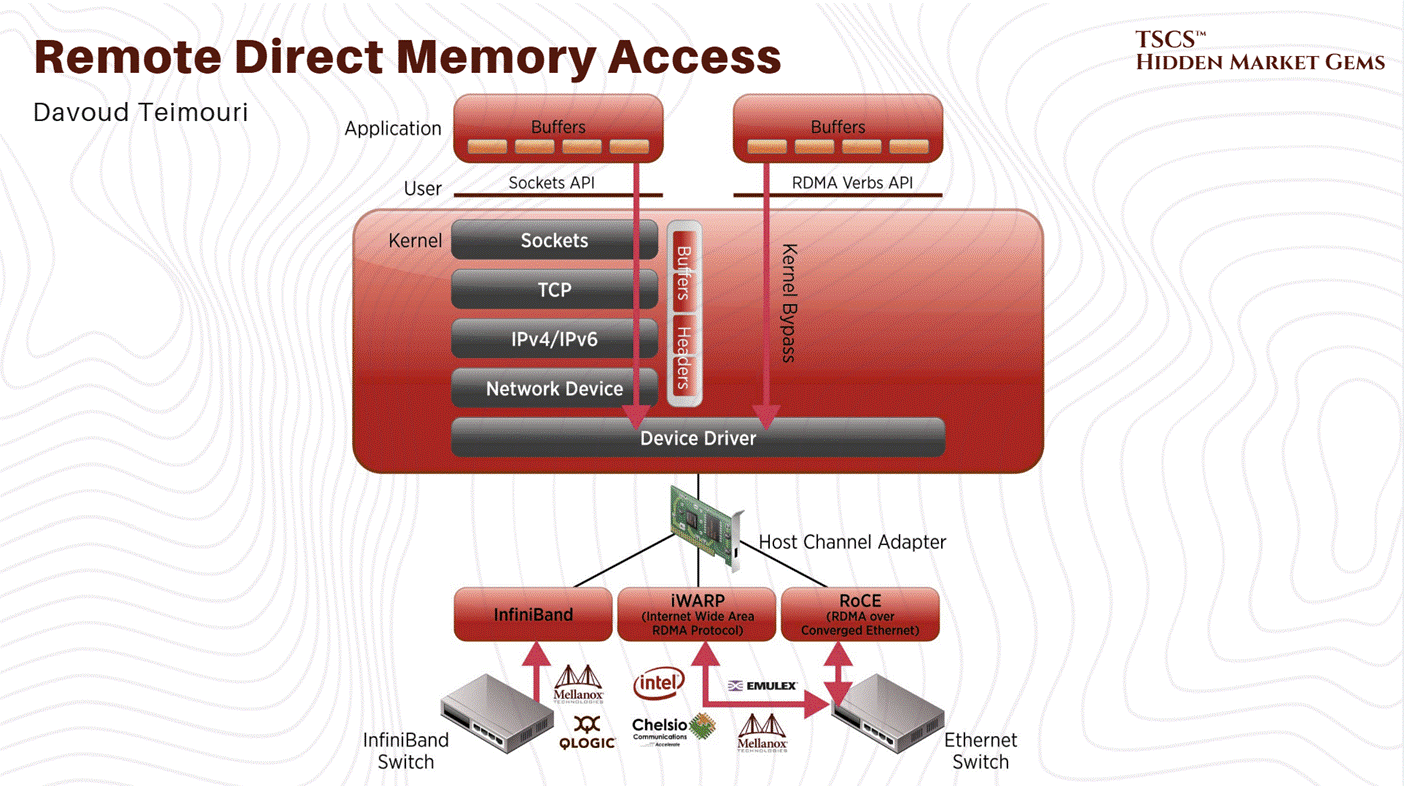
But getting RDMA to work requires the hardware (NICs), the drivers (OFED), and the OS to all sing in perfect harmony. Often, they don’t. A driver update breaks the RDMA stack. A kernel patch introduces latency. It is a constant battle to keep the Ferrari running.
7.2.2 Storage Networking
Then you have storage vendors like VAST Data. In the AI world, you need to feed the GPUs with massive amounts of data, so storage speed is critical. VAST promises the world, Universal Storage, killing the tiering problem, flash speed for everything. But what’s the reality of dealing with these systems?
“Their CLI sucks,” says one engineer who has to live with it. Troubleshooting requires diving into a proprietary Linux OS and digging through Docker containers that you aren’t supposed to touch. Their “enterprise” support? It can be a black hole. No knowledge base, and the installation guide is a wiki that changes frequently and is hard to search.
Protocol support is another minefield. They might support NFSv3 solidly, the cockroach of file protocols that will survive a nuclear war, but NFSv4 and SMB can be trash. You are promised that “it’ll get better next release,” a refrain that every sysadmin has heard a thousand times.
And yet, companies buy it. Why? Because when it works, it connects to everything. It handles the heterogeneity of the modern data center, Ethernet, 100-400Gb Infiniband, HPE Slingshot, all connecting to the same storage namespaces. The interoperability is the selling point. You pay a premium for a product that makes you miserable in the day-to-day administration, simply because it is the only thing that connects your mess of disparate hardware together without falling over.
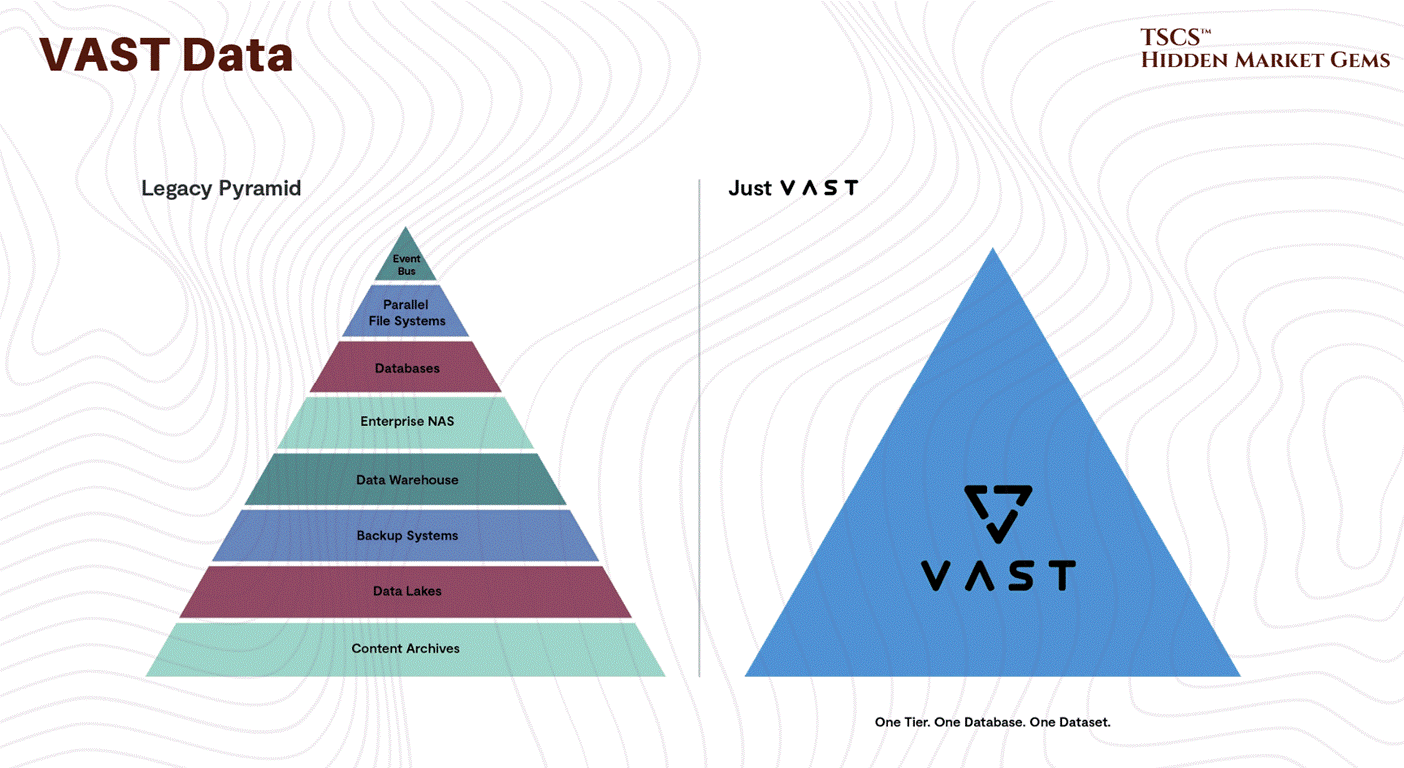
The lesson here is simple: The “Value Chain” often involves paying millions of dollars for a product that you hate, because the alternative is building it yourself, which you hate even more.
7.3 Thermodynamics vs. P&L
Now we get to the physical reality. You can write all the Python code you want, and you can optimize your network topology until it’s perfect, but eventually, that code turns into heat. Lots of it.
7.3.1 The Closed Loop Lie
In places like Oregon, Amazon is sucking tens of millions of gallons from aquifers. The dirty secret is that they could use closed-loop systems (where the water recycles and isn’t lost). Europe mostly demands this. But open-loop systems (evaporative) are cheaper. They skip the energy-intensive “pump heat out to the atmosphere” part by just using the phase change of water to absorb the energy.
“Who cares about the water anyway, there’s monies to be made,” is the silent motto of the industry. And it gets worse. They often dump the wastewater, concentrated with minerals and salts from the evaporation process, back into the system. In Oregon, the wastewater had 56 ppm nitrates, while local wells were testing above 70 ppm. This is a tragedy of the commons, accelerated by your ChatGPT prompts. It’s like burning the walls of your house to stay warm, effective in the short term, disastrous in the long term.
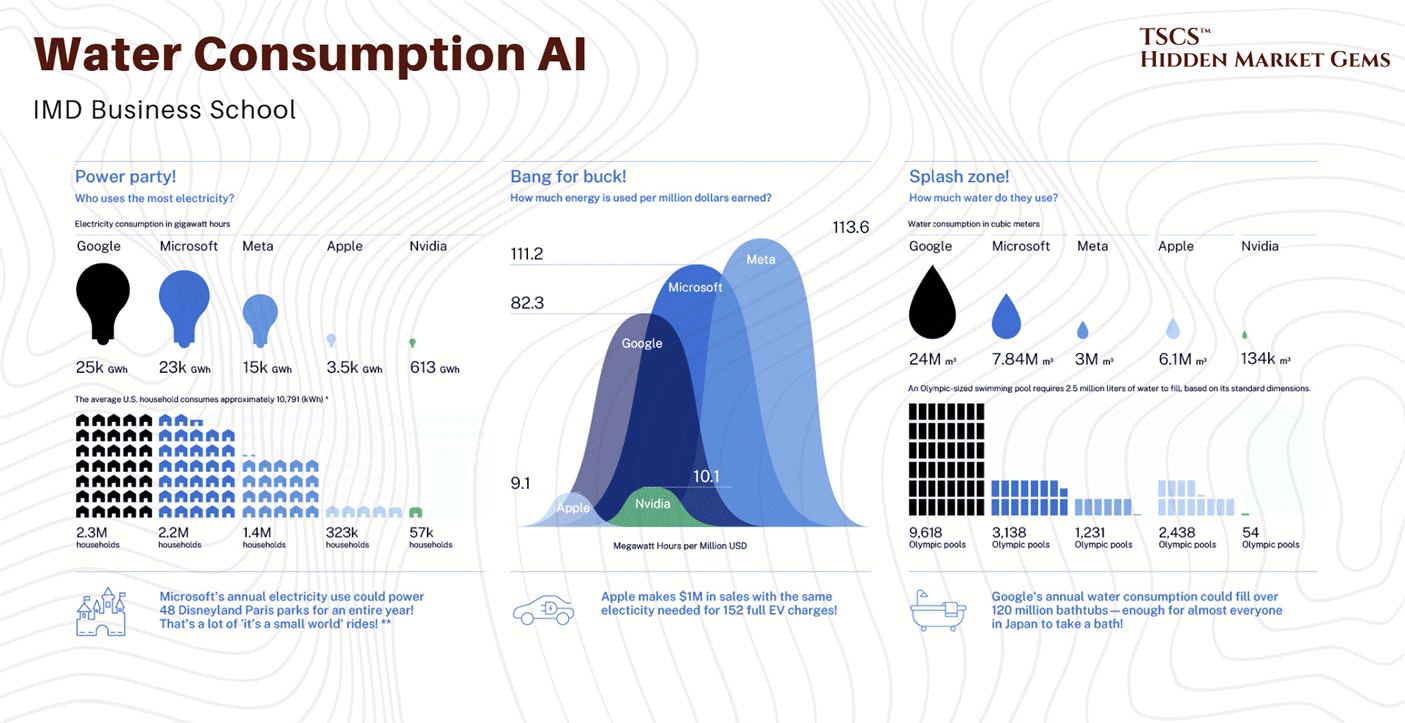
Robert Bryce spoke about the impacts of this in terms of land-use conflicts in his post “The Data Center Backlash Is Global”
7.3.2 Geography of the Cloud
If heat is the problem, why don’t we just build all the data centers in the Arctic? Or at least in North Dakota or Canada?
It seems logical. But the value chain is constrained by more than just temperature.
Infrastructure: You need power and fiber. North Dakota has limited infrastructure for data and power compared to the dense corridors of the East Coast.
Latency: Increased latency from being far away from the internet exchanges in Ashburn or Chicago makes real-time applications sluggish.
Human Capital: “Think of how high of salaries you’d have to pay people who are qualified to live in the area,” notes one observer. Getting a qualified network engineer to move to Minot, North Dakota, requires a massive premium.
Air Quality: Cooling with outdoor air (free cooling) requires the air to be filtered and humidity controlled. In agricultural or dusty areas, this is a massive added cost.
Regulation: Canada has native title laws and environmental assessments that can lock you up in court for years. You might get approved, but by the time you do, your hardware is three generations old.
[February 2026 Update: The regulatory response to data center water consumption is accelerating faster than most operators anticipated. Oregon's Governor Kotek announced a 7-member Data Center Advisory Committee on January 20, 2026, tasked with delivering policy recommendations by October 2026 on siting, energy, and water protections. This is a direct response to the water stress this primer flagged: Boardman's data centers now consume over 1 million gallons per month per facility, and Google's The Dalles facilities used 355 million gallons in 2021, roughly 25 to 30% of the city's total supply. Illinois introduced the POWER Act on February 11, 2026, which would establish comprehensive water, energy, and environmental regulations for hyperscale facilities. A UC Berkeley report the same day recommended California act before more facilities are built. The Congressional Research Service noted in a January 23 update that no federal regulations specifically govern data center water quantity. The regulatory gap is closing, and operators who are not planning for water constraints are planning to be surprised.]
Geopolitics: Russia is cold and has cheap power. It is also an option only if you “don’t mind offshoring all the data and chips into a superpower with a well-known proclivity for cyber espionage”.
So, we stick them in Virginia. We piggyback on the infrastructure built for the NSA, CIA, and DARPA decades ago. We drain the water, we stress the grid, and we pretend it’s sustainable because the latency is low and the fiber is already in the ground.
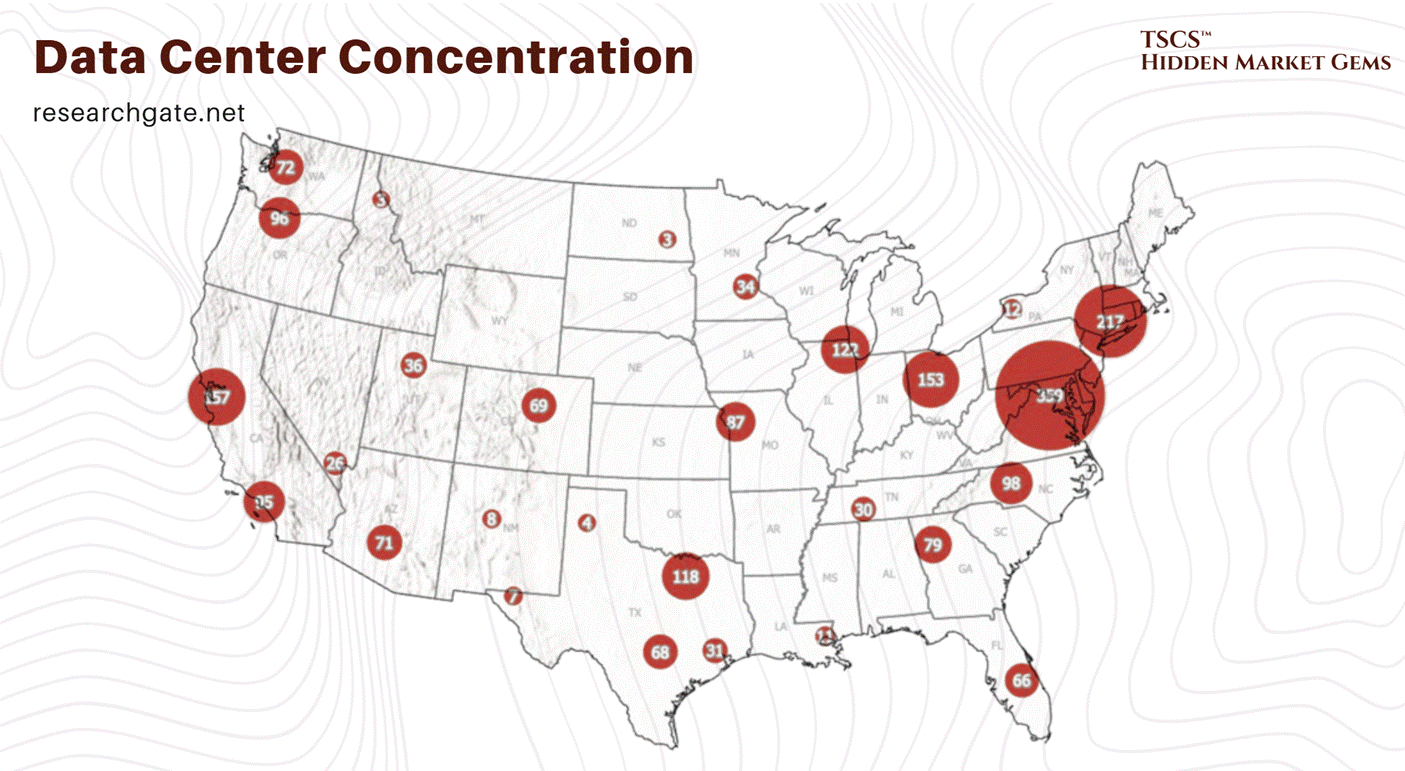
7.4 REITs, Ratios & Money
You can’t map the value chain without mapping the money. And in the data center world, the money lives in REITs (Real Estate Investment Trusts). These are the landlords of the internet.
7.4.1 The Free Money Myth
There is a persistent, almost pathological belief among amateur investors (the “Reddit crowd”) that REITs are “free money.” You buy the stock, you get the dividend, you get rich. “Just free money from parents,” as one idiot describes the attitude.
This is, of course, complete bullshit.
“There is no free money glitch,”. If a company pays out a 2% dividend, the stock price drops by 2% on the ex-dividend date. You haven’t created value; you’ve just created a taxable event. REITs are not magic money printing machines. They are businesses that own, as one landlord put it, “Toilets, taxes, and tenants”. In the case of data centers, the “tenants” are servers, the “toilets” are cooling towers that leak, and the “taxes” are property taxes on massive industrial facilities.
A mix of REIT types (Mortgage, Data Center, Farm, Hospital, Prison) can produce income, but it requires detailed analysis to avoid “yield traps”. Just because a stock has a high yield doesn’t mean it’s good; it often means the market expects the dividend to be cut.
We made a very important post on why these are uneconomical here:
7.4.2 AFFO vs. Net Income
If you look at a Data Center REIT’s “Net Income” (GAAP), you are looking at a useless number. It is a fiction.
Why? Because GAAP accounting forces real estate companies to depreciate their assets. It assumes that a building loses value every year. But in the real world, well-maintained real estate usually appreciates or holds value. So, depreciation artificially lowers Net Income, making the REIT look less profitable than it actually is on paper.
To fix this, the industry invented FFO (Funds From Operations).
The formula is generally:
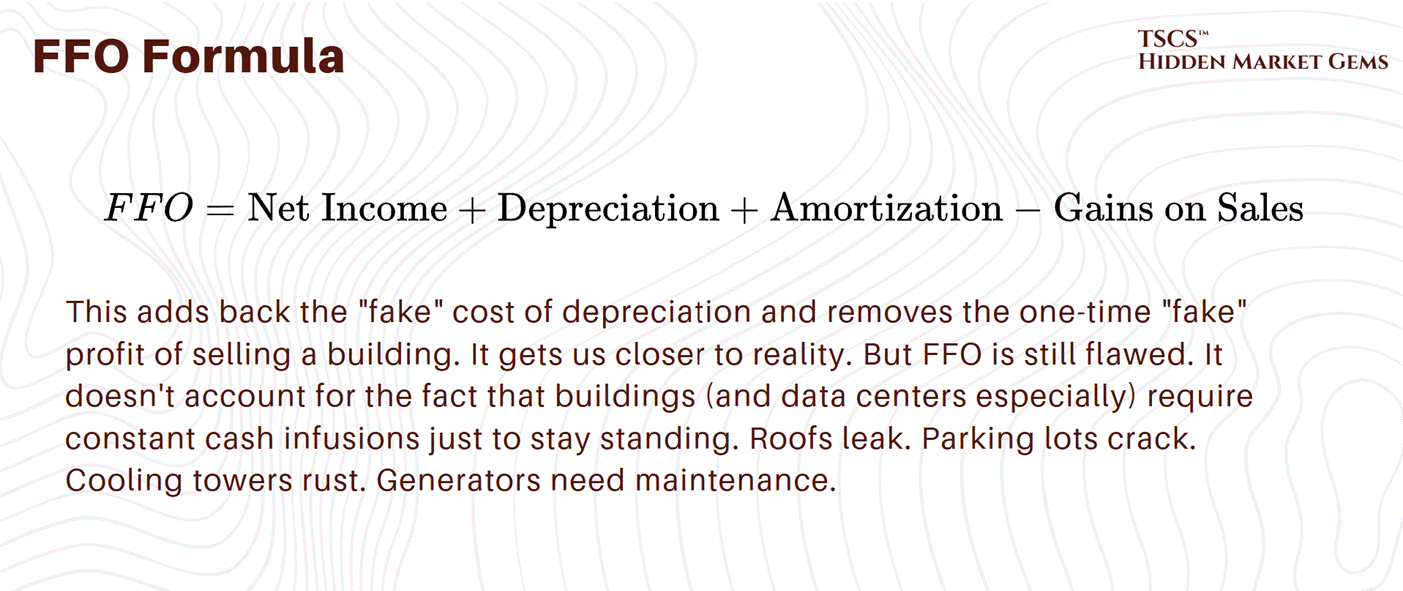
Enter AFFO (Adjusted Funds From Operations). This is the holy grail. The truth serum.
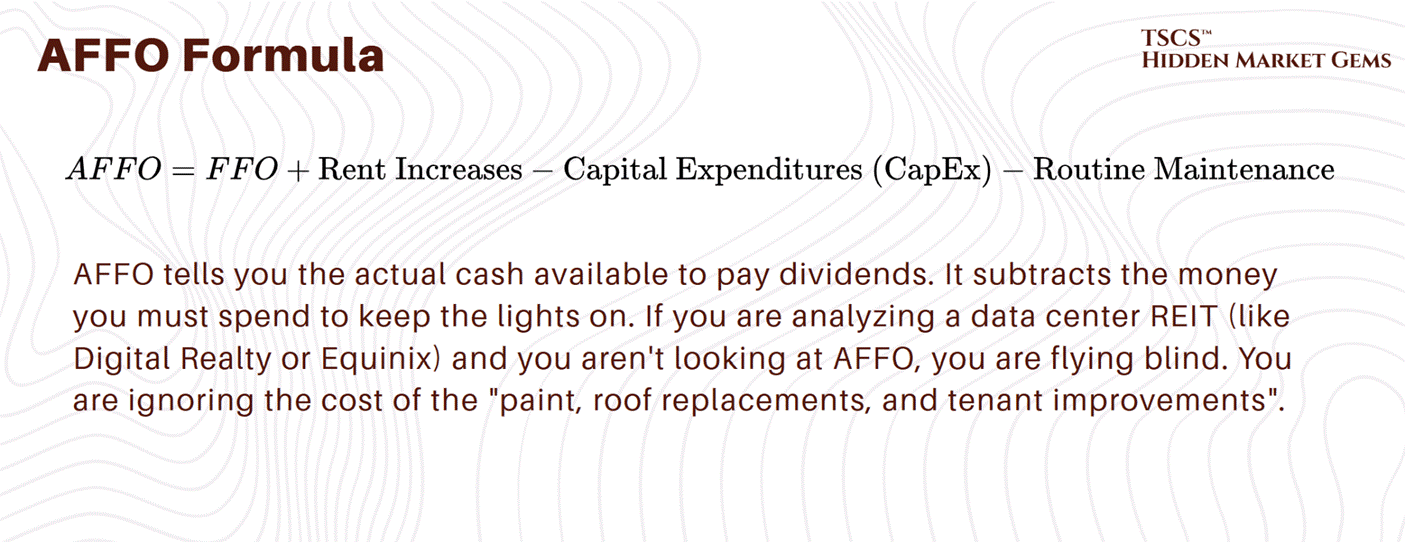
In the data center world, where you have to “rip out existing infrastructure” every few years to support new liquid cooling tech , that CapEx number is massive. It eats into the cash flow like a termite infestation. A REIT might show great FFO, but if their CapEx is skyrocketing because they have to upgrade every rack for the H100s, their AFFO will tank, and your dividend is at risk.
7.4.3 Street Slang
To survive in this value chain, you need to speak the language. The financial layer has its own dialect, designed to obfuscate and signal tribal membership.
The Book-to-Bill Ratio:
In the semiconductor world (the chips filling these data centers), this is the heartbeat of the supply chain. It is the ratio of orders taken (booked) to products shipped (billed).
> 1: The company is growing. Demand exceeds supply. This is where Nvidia is right now.
< 1: The company is shrinking. The party is over.
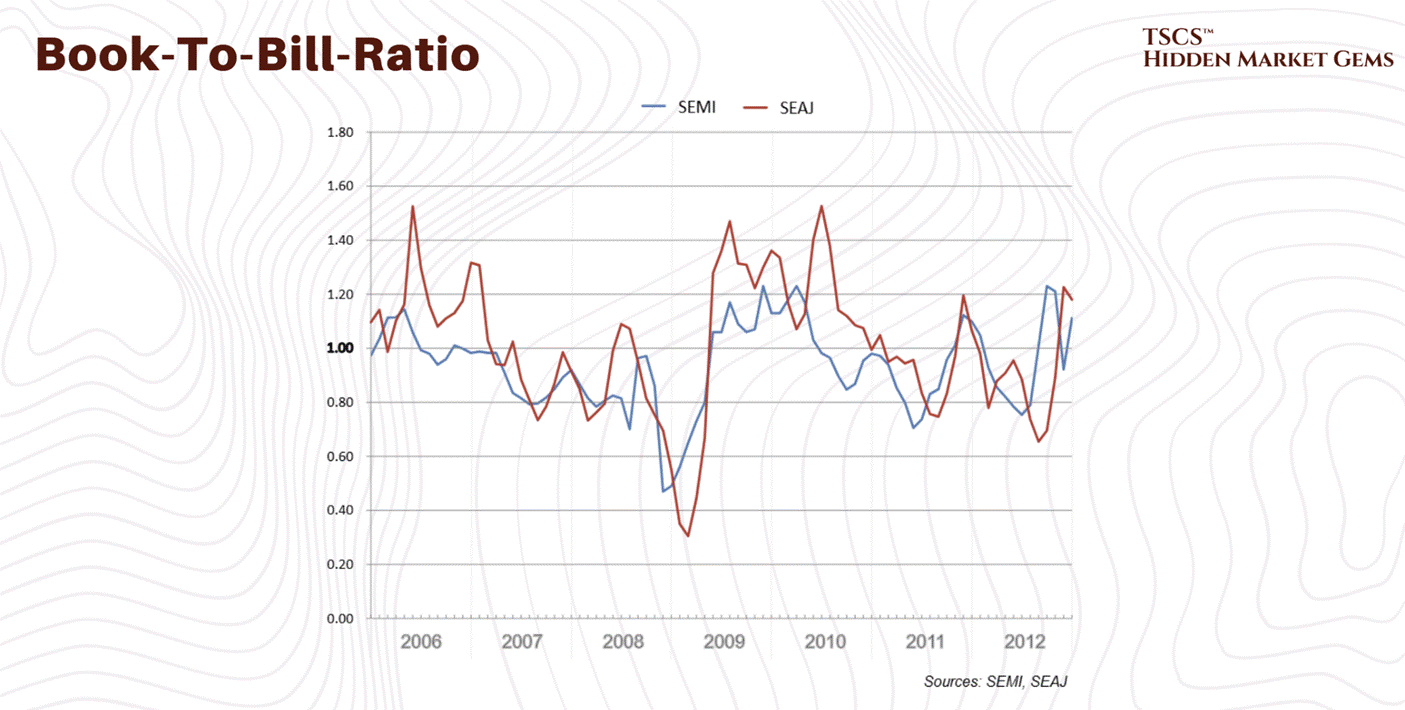
This metric is critical because it predicts the future. But forecasting is flawed. “Real-world language is messy... forecasting models have laid bare a simple truth,”. Companies struggle with flawed forecasting, leading to Inventory Gluts. When the AI hype cools, and it will, we will see a massive inventory glut of GPUs. The “Book-to-Bill” will crash below 1. That is when the pain starts. That is when the layoffs happen.
The Value Trap:
This is a stock that looks cheap, it has a low Price-to-Earnings (P/E) ratio, but is actually dying. A company like Intel might look like a value play because it’s cheap compared to Nvidia. But if their technology is obsolete, it’s a trap. “The government does not have intentions to subsidize... so that is a value trap,”. Don’t catch a falling knife just because it has a low multiple. You need to distinguish between a company that is undervalued and a company that is essentially a walking corpse.
SaaS Metrics: CARR vs. ARR vs. Magic Number:
The software running on these chips (the SaaS layer) has its own metrics.
ARR (Annual Recurring Revenue): The standard metric. The yearly value of subscriptions.
CARR (Contracted Annual Recurring Revenue): This is the optimistic cousin of ARR. It annualizes all active contracts, giving a broader view of what’s locked in, versus just what’s billing this month. It’s a way to pump the numbers for investors, or a way to see true health, depending on how cynical you are.
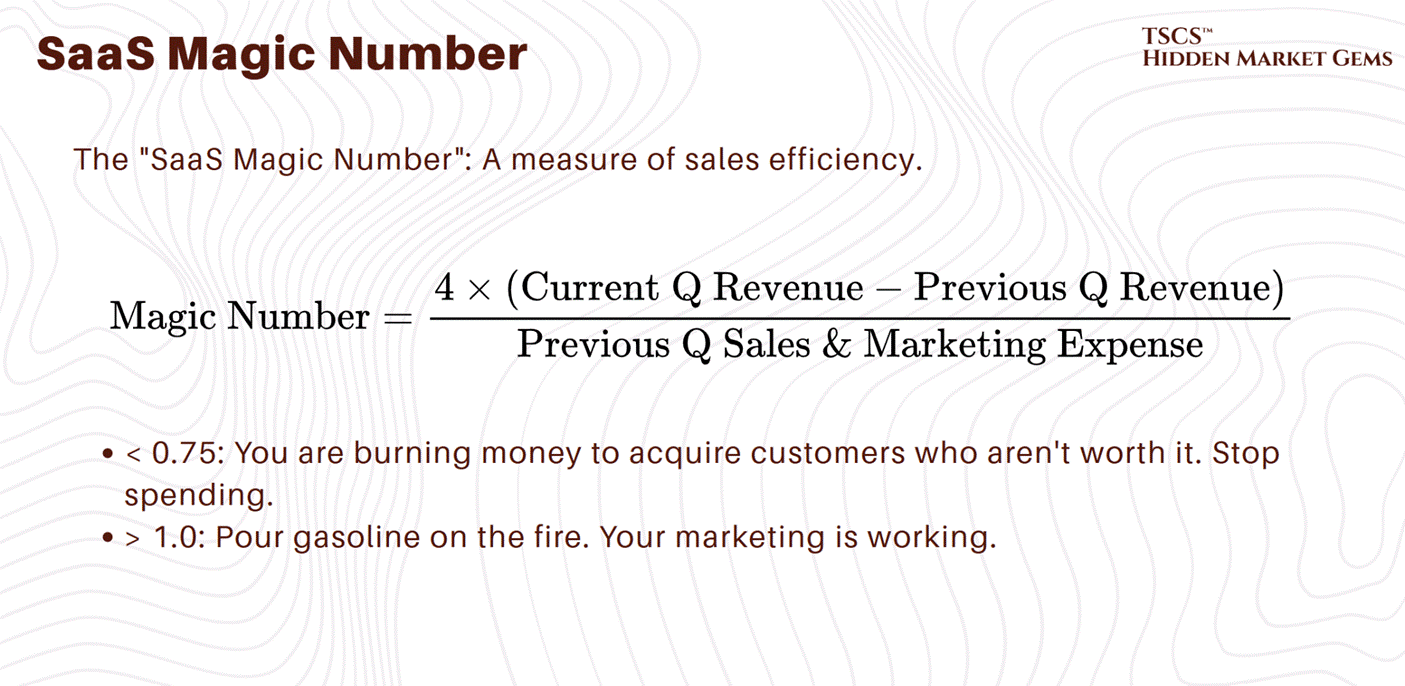
The Hype Factor:
Some investors even try to quantify the bullshit. The “Hype Factor” is a ratio of the capital raised to the actual ARR. It measures how much of the company’s valuation is based on dreams versus reality. In the AI value chain right now, the Hype Factor is off the charts.
Read Doug OLaughlin’s post “Market Volatility: Some Thoughts” if you want an even better perspective.
7.5 The Heat-Money Cycle
So, what have we learned mapping this value chain?
We learned that it is circular, self-reinforcing, and brutally physical.
Money (from REITs and VCs) buys Chips (Nvidia).
Chips generate Heat (Thermodynamics).
Heat requires Water and Infrastructure (Physical Layer).
Infrastructure requires more Money (CapEx), which depresses AFFO.
AFFO dictates the stock price, which dictates the ability to raise Money.
The weak points are obvious. The Software Lock-in (CUDA) is robust but creates a single point of failure for the industry. If Nvidia stumbles, the whole stack shakes. The Physical Layer is hitting environmental limits; you can’t drain aquifers forever without political blowback or regulatory hammer. The Financial Layer is built on the assumption of infinite growth, that “Book-to-Bill” will always be >1 and that someone will always pay the rent.
But markets are cyclical. “Inventory gluts” happen. “Value traps” appear. And eventually, the physics of cooling might make the OpEx of these centers unsustainable in the wrong climates.
The winners in this value chain aren’t just the ones with the best chips. They are the ones who can manage the entropy, both the thermal entropy in the server racks and the financial entropy in the balance sheets.
If you are investing, buying, or building in this space: Look at the AFFO, check the water rights, and for god’s sake, don’t believe the “free money” hype. It’s a grind. It’s dirty. And it’s the only game in town.
7.6 Hyperscalers & Cloud Providers
Hyperscalers (Google, Amazon…) both construct their own campuses and lease third‑party capacity (Google through their brand new chips “Tensor Processing Units” or TPU) or Amazon’s Trainium), so their cloud and AI revenue trajectories are the primary indicator of future infrastructure needs. Sustained double‑digit cloud segment growth, especially in AI and data analytics services, typically precedes multi‑year CapEx upcycles as they add power, space, and GPUs.
I really recommend Michael Burry’s post “The Supply-Side Gluttony Recurrence” to get another perspective on hyperscalers.
Key metrics to track include:
Cloud revenue growth rates and AI‑specific workload adoption.
Partnerships and sales of their own Chips.
Total and AI‑related CapEx guidance, including spend on data centers, networking, and accelerators.
Progress on in‑house silicon (e.g., custom AI and general‑purpose chips), which can pressure merchant silicon vendors but often increases overall compute intensity and capacity needs.
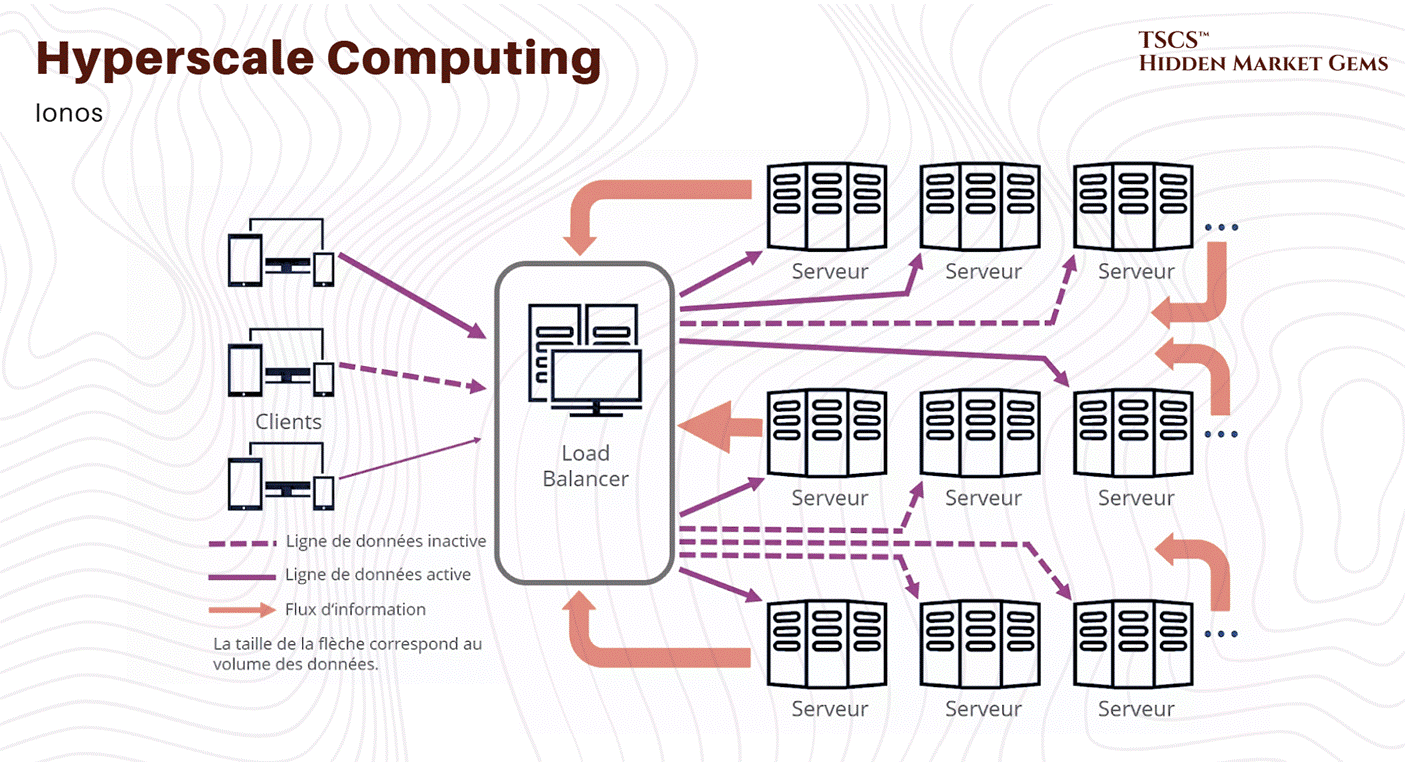
The core investment thesis is that a small group of dominant hyperscalers will continue to capture the structural shift from on‑premise IT to cloud and platform‑delivered AI services, concentrating economic power and scale advantages. Exposure to these players, directly or via key infrastructure and component suppliers, offers leveraged participation in the AI infrastructure cycle while benefiting from their pricing power and ecosystem lock‑in.
7.6.1 ETF Section
Exchange Traded Funds offer a practical way to gain diversified exposure to the digital-infrastructure theme without committing to single-stock risk. This matters because the value chain is fragmented. Data centers behave like real estate. Semiconductors behave like boom-and-bust. Fiber operators behave like utilities. Picking an ETF is really about deciding which economic engine of the AI era you want to own.
Types of Digital Infrastructure ETFs
Data Center REIT Focused (TSCS Does NOT Recommed)
These ETFs concentrate on companies that own and operate the physical buildings where compute run. They behave like REITs: predictable leases, steady cash flows, and lower volatility.
Examples:
Global X Data Center REIT & Digital Infrastructure ETF (DTCR 0.00%↑)
Pacer Data & Infrastructure Real Estate ETF (SRVR 0.00%↑)
Roundhill IO Digital Infrastructure REIT ETF (BYTE)
Typical holdings include Equinix (EQIX 0.00%↑), Digital Realty (DLR 0.00%↑), Iron Mountain (IRM 0.00%↑), and edge-data-center operators. These funds capture the “rent the space where AI happens” part of the cycle.
[Q4 2025 Earnings Update: Equinix reported revenue of $2.42 billion and AFFO of $877 million (+13% YoY), raising 2026 guidance to $4.16 to $4.24 billion in AFFO (11 to 13% growth) and announcing a 10% dividend increase. Roughly 60% of Q4's largest deals were AI-driven. Digital Realty posted revenue of $1.63 billion (+13.9% YoY), guided 2026 core FFO per share to $7.90 to $8.00, and maintains a record backlog of roughly $1.4 billion with a 5 GW development power bank. Iron Mountain reported revenue of $1.84 billion (+16.6% YoY), with data center revenue surging 39% in Q4 and AFFO growing 16.8% to $430 million. Dividend raised 10%. Current multiples: EQIX at roughly 19.5x AFFO, DLR at roughly 22.2x AFFO. Premium valuations, but the growth is real.]
More, broad Digital Infrastructure
A wider basket that blends data centers with telecom towers, fiber-optic networks, and communication infrastructure. Exposure here follows multi-year deployment cycles rather than chip cycles.
Examples:
Global X Internet of Things ETF (SNSR 0.00%↑)
iShares U.S. Infrastructure ETF (IFRA 0.00%↑)
Fidelity Cloud Computing ETF (hybrid exposure: cloud operators + infrastructure) (FCLD 0.00%↑)
These tend to hold American Tower (AMT 0.00%↑), Crown Castle (CCI 0.00%↑), Lumen (LUMN 0.00%↑), Zayo-type operators, fiber contractors, and regional network providers. So your exposition so more broad digital infras.
AI/Cloud/Semiconductor Thematic
These ETFs tilt toward the compute layer: GPU suppliers, chip manufacturers, networking silicon, and hyperscalers. Higher upside, higher volatility. Examples:
VanEck Semiconductor ETF (SMH 0.00%↑)
iShares Semiconductor ETF (SOXX 0.00%↑)
Global X Cloud Computing ETF (CLOU 0.00%↑)
Roundhill Generative AI ETF (CHAT 0.00%↑)
Holdings typically include Nvidia (NVDA 0.00%↑), Broadcom (AVGO 0.00%↑), AMD (AMD 0.00%↑) , Taiwan Semiconductor Manufacturing (TSM 0.00%↑), Advanced Semiconductor Materials Lithography (ASML 0.00%↑), and cloud hyperscalers. These ETFs capture the “AI capex boom” directly, but not the power, fiber, or real-estate layers beneath.
ETF Analysis Framework
Thematic Purity
Start by checking if the ETF genuinely targets the layer you want.
SRVR 0.00%↑ is nearly pure-play data center and digital REITs.
SMH 0.00%↑ is pure semiconductors.
CHAT 0.00%↑ blends chips, cloud, and software, so not truly “infrastructure”.
The objective statement reveals whether you’re buying buildings, fiber, or silicon.
Holdings Review
Top holdings expose the real structure:
SRVR 0.00%↑ → Equinix, Digital Realty, American Tower (physical infrastructure)
SMH 0.00%↑ → Nvidia, TSMC, ASML (manufacturing + compute)
CLOU 0.00%↑ → Okta (OKTA 0.00%↑), Cloudflare (NET 0.00%↑), Oracle (ORCL 0.00%↑) (cloud ecosystems)
This step tells you which economic cycle you’re actually exposed to.
Concentration Risk
Some ETFs behave like a basket of giants rather than a diversified theme.
SMH 0.00%↑ often has 55–65 % of the fund in its top 5 names.
SRVR 0.00%↑ is more balanced, typical REIT diversification.
BYTE and DTCR 0.00%↑ are less concentrated but have lower AUM.
High concentration = higher volatility and stronger correlation with the leading company (usually Nvidia).
Key Metrics
Expense Ratio: SMH 0.00%↑ (0.35 %), SOXX 0.00%↑ (0.40 %), SRVR 0.00%↑ (0.60 %), CHAT 0.00%↑ (0.75 %).
AUM: SMH 0.00%↑ is extremely liquid (>10B), SRVR 0.00%↑ is mid-sized, DTCR 0.00%↑ / BYTE smaller.
Liquidity: Semiconductor ETFs are the easiest to trade; smaller thematic ETFs can have wide bid-ask spreads.
Geographic Exposure
SMH 0.00%↑ / SOXX 0.00%↑: Heavy U.S. + Taiwan exposure (TSM 0.00%↑, NVDA 0.00%↑).
SRVR 0.00%↑ / BYTE: Primarily U.S. and Europe, since most data-center REITs are Western operators.
IFRA 0.00%↑: U.S.-centric infrastructure spending.
CHAT 0.00%↑: Global, but weight tilts to U.S. big tech due to index construction.
Regional concentration changes sensitivity to regulation, energy costs, and government capex cycles.
Conclusion
We started this post by murdering the “Cloud” myth, and we end it the same way. A data center is not software. It is a heavy industrial system built to fight physics with money, redundancy, and a lot of chilled water. When it works, it looks like magic. When it fails, it fails like a factory. Loudly. Expensively. Sometimes embarrassingly.
If you take one mental model away, make it this: the unit of the industry is the megawatt. Not the square foot, not the server count, not the buzzwords in an AWS keynote. Everything cascades from that single constraint. Power availability decides geography. Heat decides architecture. Latency decides where value concentrates. Water decides which communities will tolerate you. And supply chains decide who gets to build at all.
For investors, its simple: most people will argue about applications, model quality, and chatbots. The money, for a long time, follows bottlenecks. Power gear, cooling, high-speed networking, and the landlords who own the scarce, permitted, powered sites. When the hype wave fades, these constraints stay.
So if you want to actually become “expert-level” on data centers, stop reading slogans and start tracking the physical scorecard: megawatts secured, interconnection timelines, redundancy topology, rack density readiness, cooling method, and the local politics of water and grid expansion. Add the financial translation on top (leases, spreads, backlog, P/AFFO, ROIC, customer concentration), and you’re no longer guessing.
Thank you for reading this post, consider supporting our work by becoming a paid or free subscriber.
We also recommend supporting Hidden Market Gems:
Disclaimer: The information provided on this Substack is for general informational and educational purposes only, and should not be construed as investment advice. Nothing produced here should be considered a recommendation to buy or sell any particular security.
 | A guest post by
|
I read the entire report. Highly illuminating, detailed , and even funny. Rock star effort !!! Thank you 🙏
Thanks again for doing this. The scope is much appreciated. I have one expansion based on my recent years as a REIT analyst (but not one who focused on Data Center REITs). AFFO has no formal definition. Many REITs subtract "maintenance capex" but not "growth capex," and the distinction between the two is nuanced. So some REITs report an AFFO that is significantly larger than what I would view as their Funds Available for Distribution. I discuss this most recently here: https://focusedinvesting.substack.com/p/judging-reit-articles